
Mathematics, 11.01.2021 20:10 PKTHUNDER5011
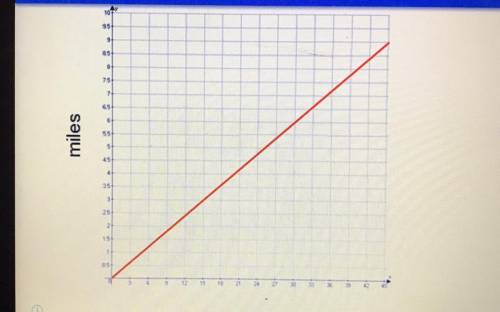
The graph below represents the distance Tommy ran (in miles) with respect to his time (minutes). Find a linear equation that represents this data.
D = 1/5t
D = 1t
D = 5t
D = 9t

Answers: 1


Another question on Mathematics
Mathematics, 21.06.2019 18:30
Nick has box brads. he uses 4 brads for the first project. nick let’s b represent the original number of brads and finds that for the second project, the number of brads he uses is 8 more than half the difference of b and 4. write an expression to represent the number of brads he uses for the second project.
Answers: 3
Mathematics, 21.06.2019 21:30
Name and describe the three most important measures of central tendency. choose the correct answer below. a. the mean, sample size, and mode are the most important measures of central tendency. the mean of a data set is the sum of the observations divided by the middle value in its ordered list. the sample size of a data set is the number of observations. the mode of a data set is its highest value in its ordered list. b. the sample size, median, and mode are the most important measures of central tendency. the sample size of a data set is the difference between the highest value and lowest value in its ordered list. the median of a data set is its most frequently occurring value. the mode of a data set is sum of the observations divided by the number of observations. c. the mean, median, and mode are the most important measures of central tendency. the mean of a data set is the product of the observations divided by the number of observations. the median of a data set is the lowest value in its ordered list. the mode of a data set is its least frequently occurring value. d. the mean, median, and mode are the most important measures of central tendency. the mean of a data set is its arithmetic average. the median of a data set is the middle value in its ordered list. the mode of a data set is its most frequently occurring value.
Answers: 3
Mathematics, 21.06.2019 22:00
Students at a high school were asked about their favorite outdoor activity. the results are shown in the two-way frequency table below. fishing camping canoeing skiing total boys 36 44 13 25 118 girls 34 37 22 20 113 total 70 81 35 45 231 select all the statements that are true based on the given table. more girls chose camping as their favorite outdoor activity than boys. more girls chose canoeing as their favorite outdoor activity than those who chose skiing. more boys chose skiing as their favorite outdoor activity than girls. there were more boys surveyed than girls. twice as many students chose canoeing as their favorite outdoor activity than those who chose fishing. more students chose camping as their favorite outdoor activity than the combined number of students who chose canoeing or skiing.
Answers: 1
Mathematics, 21.06.2019 22:30
Which description is represented by a discrete graph? kiley bought a platter for $19 and several matching bowls that were $8 each. what is the total cost before tax? the temperature at 9 a.m. was 83° f and is heating up at an average rate of 6°f per hour. what is the temperature x hours later? juan ate an egg with 78 calories and some cereal with 110 calories per serving for breakfast. what is the total amount of calories he consumed? a bottle contained 2,000 ml of liquid and is being poured out at an average rate of 300 ml per second. how much liquid is left in the bottle after x seconds?
Answers: 3
You know the right answer?
The graph below represents the distance Tommy ran (in miles) with respect to his time (minutes). Fin...
Questions
Mathematics, 23.08.2019 22:00
Mathematics, 23.08.2019 22:00

Biology, 23.08.2019 22:00

Biology, 23.08.2019 22:00

Social Studies, 23.08.2019 22:00
Biology, 23.08.2019 22:00
Mathematics, 23.08.2019 22:00
Mathematics, 23.08.2019 22:00

Geography, 23.08.2019 22:00

History, 23.08.2019 22:00

Mathematics, 23.08.2019 22:00


