
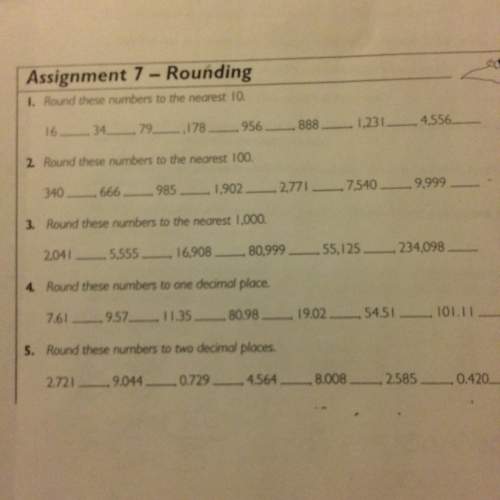
Mathematics, 13.01.2021 03:20 jamesk5671
Major League Baseball now records information about every pitch thrown in every game of every season. Statistician Jim Albert compiled data about every pitch thrown by 20 starting pitchers during the 2009 MLB season. The data set included the type of pitch thrown (curveball, changeup, slider, etc.) as well as the speed of the ball as it left the pitcher’s hand. A histogram of speeds for all 30,740 four-seam fastballs thrown by these pitchers during the 2009 season is shown below, from which we can see that the speeds of these fastballs follow a Normal model with mean μ = 92.12 mph and a standard deviation of σ = 2.43 mph.
Compute the z-score of pitch with speed 97.5 mph. (Round your answer to two decimal places.)
Approximately what fraction of these four-seam fastballs would you expect to have speeds between 90.4 mph and 91.8 mph? (Express your answer as a decimal, not a percent, and round to three decimal places.)
Approximately what fraction of these four-seam fastballs would you expect to have speeds above 91.8 mph? (Express your answer as a decimal, not a percent, and round to three decimal places.)
A baseball fan wishes to identify the four-seam fastballs among the slowest 2% of all such pitches. Below what speed must a four-seam fastball be in order to be included in the slowest 2%? (Round your answer to the nearest 0.1 mph.)

Answers: 2


Another question on Mathematics
Mathematics, 21.06.2019 15:30
State whether weight is a function of height for the six students and explain. a. yes, height is a function of weight because two students weigh 165 pounds but have different heights. b. no, height is not a function of weight because two students weigh 165 pounds but have different heights. c. yes, weight is a function of height because for each value of height there is one corresponding value of weight. d. no, weight is not a function of height because there is not enough data to determine a function.
Answers: 1
Mathematics, 21.06.2019 19:50
Which of the following describes the graph of y--4x-36 compared to the parent square root function? stretched by a factor of 2, reflected over the x-axis, and translated 9 units right stretched by a factor of 2, reflected over the x-axis, and translated 9 units left stretched by a factor of 2, reflected over the y-axis, and translated 9 units right stretched by a factor of 2, reflected over the y-axis, and translated 9 units left save and exit next submit
Answers: 1
Mathematics, 22.06.2019 00:30
How many square centimeters of wrapping paper will be used to wrap the shoe box?
Answers: 2
Mathematics, 22.06.2019 00:30
Can someone me immediately, this is due by midnight! if you can't see the question, i'll text it to you. show the steps you took to get your answer.
Answers: 2
You know the right answer?
Major League Baseball now records information about every pitch thrown in every game of every season...
Questions
Mathematics, 15.05.2021 01:00

Mathematics, 15.05.2021 01:00
Mathematics, 15.05.2021 01:00

Mathematics, 15.05.2021 01:00

Health, 15.05.2021 01:00

Mathematics, 15.05.2021 01:00
Mathematics, 15.05.2021 01:00
Mathematics, 15.05.2021 01:00
Mathematics, 15.05.2021 01:00
Mathematics, 15.05.2021 01:00


