
Mathematics, 13.01.2021 05:40 ani61
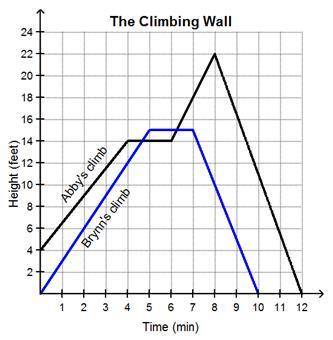
The graph represents the heights of two climbers on a climbing wall over a 12-minute time period.
A graph titled The Climbing Wall where the horizontal axis shows time (minutes), numbered 1 to 12, and the vertical axis shows height (feet) numbered 2 to 24. The line labeled Brynn's climb begins at 0 feet in 0 minutes, to 15 feet from 5 to 7 minutes, to 0 feet in 10 minutes. The line labeled Abby's climb begins at 4 feet in 0 minutes, to 14 feet from 4 to 6 minutes, to 22 feet in 8 minutes, to 0 feet in 12 minutes.
Which statement is true about the climbers’ heights?
Brynn was resting at a constant climbing height when Abby’s climbing height was decreasing.
Abby’s climbing height was decreasing when Brynn’s climbing height was increasing.
The heights of both climbers increased, then decreased, with no rest at a constant height.
Both climbers rested on the wall at a constant height for 2 minutes.

Answers: 3


Another question on Mathematics
Mathematics, 21.06.2019 23:30
Katie wants to collect over 100 seashells. she already has 34 seashells in her collection. each day, she finds 12 more seashells on the beach. katie can use fractions of days to find seashells. write an inequality to determine the number of days, dd, it will take katie to collect over 100 seashells.
Answers: 1
Mathematics, 22.06.2019 01:30
Have you ever been in the middle of telling a story and had to use hand gestures or even a drawing to make your point? in algebra, if we want to illustrate or visualize a key feature of a function, sometimes we have to write the function in a different form—such as a table, graph, or equation—to determine the specific key feature we’re looking for. think about interactions with others and situations you’ve come across in your own life. how have you had to adjust or change the way you represented something based on either the concept you were trying to describe or the person you were interacting with? explain how the complexity or layout of the concept required you to change your style or presentation, or how the person’s unique learning style affected the way you presented the information.
Answers: 1
Mathematics, 22.06.2019 08:20
Isosceles triangle abc has a perimeter of 96 the base of the triangle is ac and measures 24 cm what is the measure of ab
Answers: 1
You know the right answer?
The graph represents the heights of two climbers on a climbing wall over a 12-minute time period.
A...
Questions


English, 19.12.2020 06:00
Mathematics, 19.12.2020 06:00

Advanced Placement (AP), 19.12.2020 06:00
Advanced Placement (AP), 19.12.2020 06:00
Mathematics, 19.12.2020 06:10

Mathematics, 19.12.2020 06:10

Mathematics, 19.12.2020 06:10
Mathematics, 19.12.2020 06:10
Mathematics, 19.12.2020 06:10
Mathematics, 19.12.2020 06:10

Social Studies, 19.12.2020 06:10
Mathematics, 19.12.2020 06:10
Mathematics, 19.12.2020 06:10
Mathematics, 19.12.2020 06:10


