b.) y > 3x + 2

Mathematics, 13.01.2021 19:20 robertschulte116
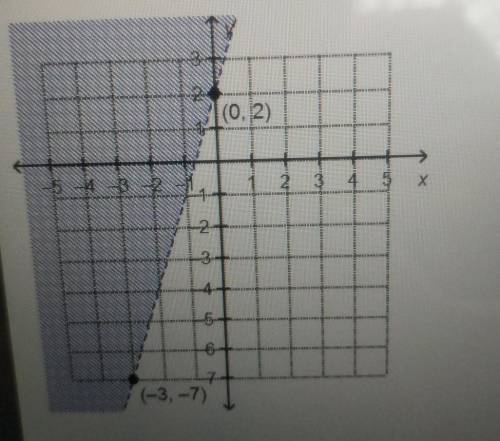
Which linear inequality is represented by the graph?
a.) y < 3x + 2
b.) y > 3x + 2
c.) y < 1/3x + 2
d.) y > 1/3x + 2

Answers: 2


Another question on Mathematics
Mathematics, 21.06.2019 17:00
The equation of a circle is (x + 4)2 + (y + 6)2 = 16. determine the length of the radius. 10 4 16 8 my flower basket delivers flowers within a 20 mile radius of their store. if this area is represented graphically, with my flower basket located at (5, 2), what is the equation that represents the delivery area? (x - 2)2 + (y - 5)2 = 20 (x - 5)2 + (y - 2)2 = 20 (x + 5)2 + (y + 2)2 = 400 (x - 5)2 + (y - 2)2 = 400
Answers: 1
Mathematics, 21.06.2019 19:00
The figures below are made out of circles, semicircles, quarter circles, and a square. find the area and the perimeter of each figure and give your answers as a completely simplified exact value in terms of π (no approximations).
Answers: 1
Mathematics, 21.06.2019 19:30
Bobby bought 1.12 pounds of turkey at a cost of 2.50 per pound. carla bought 1.4 pounds of turkey at a cost of 2.20 per pound. who spent more and by much?
Answers: 2
You know the right answer?
Which linear inequality is represented by the graph?
a.) y < 3x + 2
b.) y > 3x + 2
b.) y > 3x + 2
Questions
Mathematics, 28.03.2021 05:10
Mathematics, 28.03.2021 05:10

Mathematics, 28.03.2021 05:10
Mathematics, 28.03.2021 05:10

Spanish, 28.03.2021 05:10
Mathematics, 28.03.2021 05:10

Social Studies, 28.03.2021 05:10


Geography, 28.03.2021 05:10

Social Studies, 28.03.2021 05:10
English, 28.03.2021 05:10
Engineering, 28.03.2021 05:10

Business, 28.03.2021 05:10


