
Mathematics, 14.01.2021 09:20 zurfluhe
Which conclusion can be drawn from this graph?
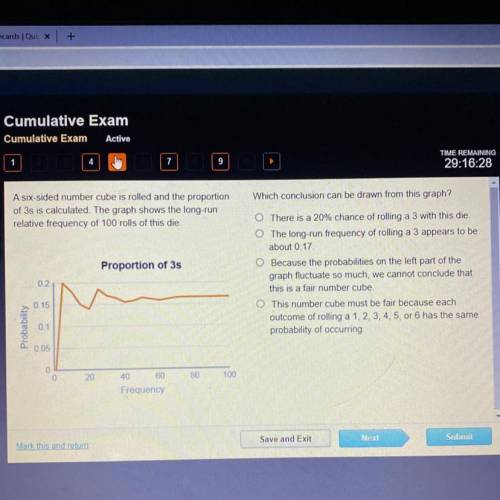
A six-sided number cube is rolled and the proportion
of 3s is calculated. The graph shows the long-run
relative frequency of 100 rolls of this die.
Proportion of 3s
O There is a 20% chance of rolling a 3 with this die.
O The long-run frequency of rolling a 3 appears to be
about 0.17
O Because the probabilities on the left part of the
graph fluctuate so much, we cannot conclude that
this is a fair number cube.
O This number cube must be fair because each
outcome of rolling a 1, 2, 3, 4, 5, or 6 has the same
probability of occurring.
02
0.15
Probability
0.1
0.05
0
20
80
100
40 60
Frequency
Mark this and return
Save and Exit
Next
Submit

Answers: 1


Another question on Mathematics
Mathematics, 21.06.2019 18:00
Pls if a cow has a mass of 9×10^2 kilograms, and a blue whale has a mass of 1.8×10^5 kilograms, which of these statements is true?
Answers: 3
Mathematics, 21.06.2019 18:30
Select 2 statements that are true about the equation y+6=-10(x-3).1) the slope of the line is -102) the slope of the line is 33) one point on the line is (3,6)4) one point on the line is (3,-6)
Answers: 1
You know the right answer?
Which conclusion can be drawn from this graph?
A six-sided number cube is rolled and the proportion...
Questions


Mathematics, 06.05.2020 00:38
Mathematics, 06.05.2020 00:38
Mathematics, 06.05.2020 00:38

Computers and Technology, 06.05.2020 00:38
Mathematics, 06.05.2020 00:38
History, 06.05.2020 00:38
Computers and Technology, 06.05.2020 00:38
Mathematics, 06.05.2020 00:38


