
Mathematics, 14.01.2021 23:10 Worldprofessor6252
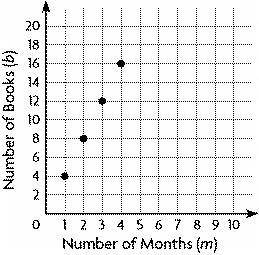
The graph shows the relationship between the number of months, m, and the number of books, b, Ivan has read.
Which list best represents the dependent values of the graphed points?
a
1, 2, 3, 4
b
4, 8, 12, 16
c
2, 4, 6, 8, 10, 12, 14, 16
d
1, 4, 2, 8, 3, 12, 4, 16

Answers: 1


Another question on Mathematics
Mathematics, 21.06.2019 22:00
Determine if the equation defines y as a function of x: 2xy = 1. yes o no
Answers: 2
Mathematics, 22.06.2019 00:00
The graph shows the amount of money noah earned based on the number of lawns he cut. which list shows the dependent quantities in the graph?
Answers: 3
Mathematics, 22.06.2019 01:20
Given: δabc, m∠1=m∠2, d∈ ac bd = dc m∠bdc = 100º find: m∠a m∠b, m∠c
Answers: 2
You know the right answer?
The graph shows the relationship between the number of months, m, and the number of books, b, Ivan h...
Questions


Business, 14.01.2021 16:10
Mathematics, 14.01.2021 16:10
Chemistry, 14.01.2021 16:10


