
Mathematics, 15.01.2021 02:00 garretthyatt123
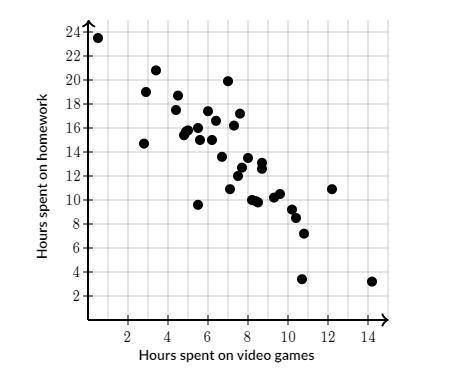
The scatter plot below shows the relationship between hours spent on video games and hours spent on homework last week for students in Ginny's class. Which of the following is the best estimate of the average change in homework time that was associated with a 1-hour increase in time spent on video games?

Answers: 3


Another question on Mathematics
Mathematics, 21.06.2019 14:30
The number of revolutions of two pulleys is inversely proportional to their diameters. if a 24-inch diameter pulley making 400 revolutions per minute is belted to an 8-inch diameter pulley, find the number of revolutions per minute of the smaller pulley.
Answers: 1
Mathematics, 21.06.2019 15:30
The ratio pv to nrt is plotted against pressure for ch4 at 0°c and 200°c. why does the curve for 0°c drop below the horizontal line for an ideal gas whereas the curve for 200°c does not?
Answers: 2
Mathematics, 21.06.2019 19:30
Hey am have account in but wished to create an account here you guys will me with my make new friends of uk !
Answers: 1
You know the right answer?
The scatter plot below shows the relationship between hours spent on video games and hours spent on...
Questions
Mathematics, 10.12.2020 17:50


Biology, 10.12.2020 17:50
Mathematics, 10.12.2020 17:50

History, 10.12.2020 17:50
Mathematics, 10.12.2020 17:50


Physics, 10.12.2020 17:50
History, 10.12.2020 17:50

Mathematics, 10.12.2020 17:50
English, 10.12.2020 17:50


