
Mathematics, 16.01.2021 06:20 adi593
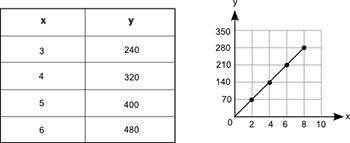
The table and the graph each show a different relationship between the same two variables, x and y:
How much more would the value of y be in the table, than its value on the graph, when x = 11?
Group of answer choices
110
170
385
495

Answers: 2


Another question on Mathematics
Mathematics, 22.06.2019 00:00
Yvaries inversely as x. y =12 when x=5. find y when x=4
Answers: 2
Mathematics, 22.06.2019 03:30
One angle of a linear pair is 10 more than two-thirds the other angle. find the measure of both angles.
Answers: 1
Mathematics, 22.06.2019 03:30
Plz , will award brainliest find an equation for the line that goes through the points (5,-8) and (13,4)
Answers: 1
You know the right answer?
The table and the graph each show a different relationship between the same two variables, x and y:...
Questions


Mathematics, 08.04.2020 03:29
Engineering, 08.04.2020 03:29


Computers and Technology, 08.04.2020 03:29

Mathematics, 08.04.2020 03:30


