
Mathematics, 17.01.2021 14:00 Scotty78
Please hurry lol
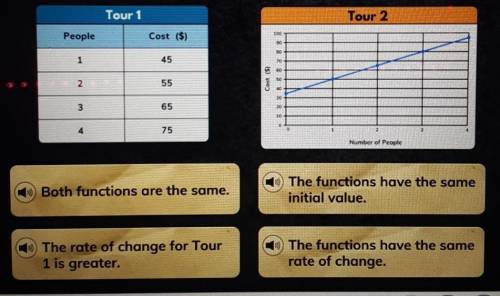
The table and graph represent two different bus tours, showing the cost as a linear function of the number of people in the group.
Which description best compares the two functions?

Answers: 1


Another question on Mathematics
Mathematics, 21.06.2019 17:00
Which simplifys to a+ b? a-(1-b)+1 -(1-a)-b+1 (a--1) -1)+1
Answers: 1
Mathematics, 21.06.2019 17:30
Noor brought 21 sheets of stickers. she gave 1/3 of a sheet to each of the 45 students at recess. she wants to give teachers 1 1/2 sheets each.
Answers: 2
Mathematics, 21.06.2019 20:00
Which statement about the annual percentage rate (apr) is not true?
Answers: 3
Mathematics, 21.06.2019 23:30
If you measured the width of a window in inches and then in feet with measurement would you have the greater number of units
Answers: 3
You know the right answer?
Please hurry lol
The table and graph represent two different bus tours, showing the cost as a linea...
Questions

Mathematics, 08.09.2021 04:20

Mathematics, 08.09.2021 04:20


Mathematics, 08.09.2021 04:20
Mathematics, 08.09.2021 04:20

Mathematics, 08.09.2021 04:20
History, 08.09.2021 04:20


Mathematics, 08.09.2021 04:30


