
Mathematics, 17.01.2021 19:50 erbnichole
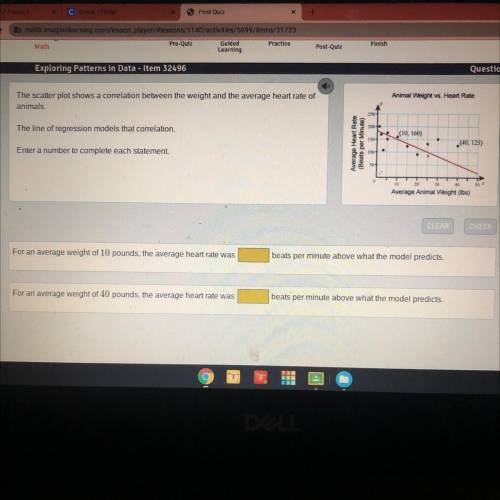
The scatter plot shows a correlation between the weight and the average heart rate of
animals.
The line of regression models that correlation.
Enter a number to complete each statement.

Answers: 1


Another question on Mathematics
Mathematics, 21.06.2019 15:10
Apatient is given 50 mg dose of medicine the medicines effectiveness decreases every hour at a constant rate of 40% what is the exponential decay function that models this scenario how much medicine will be left in the patients system after 2 hours
Answers: 3
Mathematics, 21.06.2019 18:30
How to use order of operation in 20 divide by 4 multiply 5 = 1
Answers: 1
Mathematics, 21.06.2019 22:20
(b) suppose that consolidated power decides to use a level of significance of α = .05, and suppose a random sample of 100 temperature readings is obtained. if the sample mean of the 100 temperature readings is x⎯⎯ = 60.990, test h0 versus ha and determine whether the power plant should be shut down and the cooling system repaired. perform the hypothesis test by using a critical value and a p-value. assume σ = 5. (round your z to 2 decimal places and p-value to 4 decimal places.)
Answers: 2
You know the right answer?
The scatter plot shows a correlation between the weight and the average heart rate of
animals.
Questions

Chemistry, 20.05.2021 04:00


English, 20.05.2021 04:10
Health, 20.05.2021 04:10

Biology, 20.05.2021 04:10

History, 20.05.2021 04:10
Mathematics, 20.05.2021 04:10
Mathematics, 20.05.2021 04:10


