
Mathematics, 18.01.2021 07:10 alexis123420
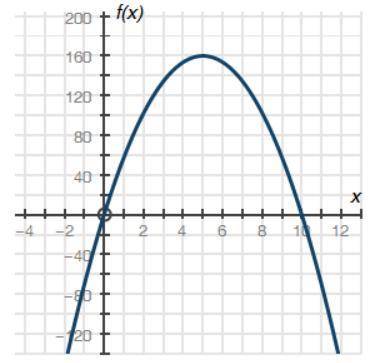
The graph below shows a company's profit f(x), in dollars, depending on the price of pencils x, in dollars, sold by the company:
Graph of quadratic function f of x having x intercepts at ordered pairs negative 0, 0 and 10, 0. The vertex is at 5, 160.
Part A: What do the x-intercepts and maximum value of the graph represent? What are the intervals where the function is increasing and decreasing, and what do they represent about the sale and profit? (4 points)
Part B: What is an approximate average rate of change of the graph from x = 2 to x = 5, and what does this rate represent? (3 points)
Part C: Describe the constraints of the domain. (3 points)

Answers: 3


Another question on Mathematics
Mathematics, 21.06.2019 20:40
What are the values of each variable in the diagram below?
Answers: 2
Mathematics, 21.06.2019 23:50
The functions f(x) and g(x) are shown in the graph f(x)=x^2 what is g(x) ?
Answers: 2
You know the right answer?
The graph below shows a company's profit f(x), in dollars, depending on the price of pencils x, in d...
Questions


Mathematics, 20.09.2019 19:00

Business, 20.09.2019 19:00
Mathematics, 20.09.2019 19:00


English, 20.09.2019 19:00


