
Mathematics, 19.01.2021 14:00 DnsMonsteR7712
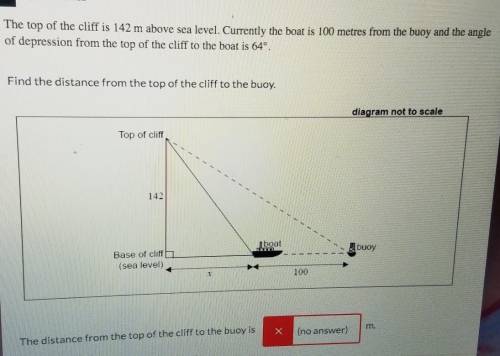
The top of the cliff is 142 m above sea level. Currently the boat is 100 metres from the buoy and the angle of depression from the top of the cliff to the boat is 64º. emo 1/14 acco Find the distance from the top of the cliff to the buoy. https: 1/14/2 diagram not to scale New N 1/14/21 Top of cliff Advisor 1/14/21 Où coure 1/13/21 5,000 follo 1/13/21 boat buoy Base of cliff (sea level) 100 (no answer) The distance from the top of the cliff to the buoy is

Answers: 2


Another question on Mathematics
Mathematics, 21.06.2019 20:30
The areas of two similar triangles are 72dm2 and 50dm2. the sum of their perimeters is 226dm. what is the perimeter of each of these triangles?
Answers: 1
Mathematics, 21.06.2019 21:00
Rewrite the following quadratic functions in intercept or factored form. show your work. y = 4x^2 - 19x- 5
Answers: 2
Mathematics, 22.06.2019 03:00
Describe how the presence of possible outliers might be identified on the following. (a) histograms gap between the first bar and the rest of bars or between the last bar and the rest of bars large group of bars to the left or right of a gap higher center bar than surrounding bars gap around the center of the histogram higher far left or right bar than surrounding bars (b) dotplots large gap around the center of the data large gap between data on the far left side or the far right side and the rest of the data large groups of data to the left or right of a gap large group of data in the center of the dotplot large group of data on the left or right of the dotplot (c) stem-and-leaf displays several empty stems in the center of the stem-and-leaf display large group of data in stems on one of the far sides of the stem-and-leaf display large group of data near a gap several empty stems after stem including the lowest values or before stem including the highest values large group of data in the center stems (d) box-and-whisker plots data within the fences placed at q1 â’ 1.5(iqr) and at q3 + 1.5(iqr) data beyond the fences placed at q1 â’ 2(iqr) and at q3 + 2(iqr) data within the fences placed at q1 â’ 2(iqr) and at q3 + 2(iqr) data beyond the fences placed at q1 â’ 1.5(iqr) and at q3 + 1.5(iqr) data beyond the fences placed at q1 â’ 1(iqr) and at q3 + 1(iqr)
Answers: 1
Mathematics, 22.06.2019 04:00
Sean is his dad build a tiled walkway in their backyard. the walkway will be 6060 feet long and 22 feet wide. the local hardware store sells tiles which are 22 by 22 feet and come in boxes of 66. how many boxes of tiles do they need?
Answers: 1
You know the right answer?
The top of the cliff is 142 m above sea level. Currently the boat is 100 metres from the buoy and th...
Questions

English, 17.11.2020 20:50
Mathematics, 17.11.2020 20:50
Mathematics, 17.11.2020 20:50
English, 17.11.2020 20:50
Mathematics, 17.11.2020 20:50
Mathematics, 17.11.2020 20:50
Mathematics, 17.11.2020 20:50

History, 17.11.2020 20:50

Chemistry, 17.11.2020 20:50


