Mathematics, 19.01.2021 22:40 Pandagurl2125
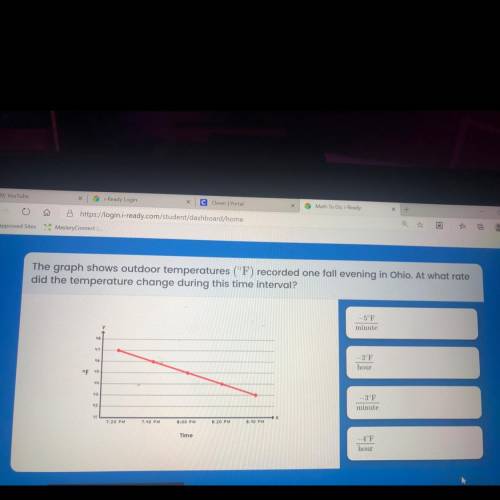
The graph shows outdoor temperatures (°F) recorded one fall evening in Ohio. At what rate
did the temperature change during this time interval?
-5°F
minute
46
-3°F
hour
OF 5
-3°F
minute
7:20 PM
7:10 PM
8:00 PM
8:20 PM
8:40 PM
Time
4°F
hour


Answers: 3


Another question on Mathematics

Mathematics, 21.06.2019 16:30
In two or more complete sentences describe how to determine the appropriate model for the set of data, (1,1), (3,2), (6,3), (11,4).
Answers: 1

Mathematics, 21.06.2019 19:30
Bobby bought 1.12 pounds of turkey at a cost of 2.50 per pound. carla bought 1.4 pounds of turkey at a cost of 2.20 per pound. who spent more and by much?
Answers: 2

Mathematics, 21.06.2019 19:30
Now max recorded the heights of 500 male humans. he found that the heights were normally distributed around a mean of 177 centimeters. which statements about max’s data must be true? a) the median of max’s data is 250 b) more than half of the data points max recorded were 177 centimeters. c) a data point chosen at random is as likely to be above the mean as it is to be below the mean. d) every height within three standard deviations of the mean is equally likely to be chosen if a data point is selected at random.
Answers: 1

Mathematics, 21.06.2019 19:30
Factor the expression using the gcf. the expression 21m−49n factored using the gcf
Answers: 2
You know the right answer?
The graph shows outdoor temperatures (°F) recorded one fall evening in Ohio. At what rate
did the t...
Questions


Mathematics, 29.09.2019 07:30


Geography, 29.09.2019 07:30

English, 29.09.2019 07:30

Mathematics, 29.09.2019 07:30

History, 29.09.2019 07:30


Geography, 29.09.2019 07:30

Mathematics, 29.09.2019 07:30

History, 29.09.2019 07:30

Mathematics, 29.09.2019 07:30

Mathematics, 29.09.2019 07:30


Social Studies, 29.09.2019 07:30

Mathematics, 29.09.2019 07:30


