
Mathematics, 20.01.2021 04:00 firstone04kr
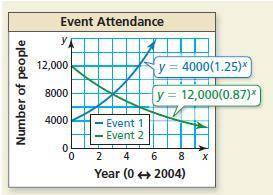
The graph shows the annual attendance at two events. Each event began in 2004.
a. Estimate when the events will have about the same attendance.
The events will have about the same attendance in the year ___.
b. Explain how you can verify your answer in part (a).
a. Substitute the answer in part (a) into both equations for y and solve for x.
b. Set the equations equal to zero, solve for x, then find the average of the two x-values.
c. Graph the two equations on a graphing calculator and use the intersect feature to find the point of intersection.
d. See how many times you have to multiply 4000 by 1.25 to obtain a product of approximately 12,000.
.

Answers: 1


Another question on Mathematics
Mathematics, 21.06.2019 22:00
cassidy wants to cut the yellow fabric into strips that are 0.3 yards wide. how many strips of yellow fabric can cassidy make? yellow fabric 16 yards for $108.00.
Answers: 1
Mathematics, 21.06.2019 23:20
Predict which statements are true about the intervals of the continuous function. check all that apply
Answers: 3
You know the right answer?
The graph shows the annual attendance at two events. Each event began in 2004.
a. Estimate when the...
Questions

Geography, 26.09.2019 06:00
Geography, 26.09.2019 06:00

History, 26.09.2019 06:00
History, 26.09.2019 06:00


English, 26.09.2019 06:00

Social Studies, 26.09.2019 06:00
Social Studies, 26.09.2019 06:00
History, 26.09.2019 06:00

Biology, 26.09.2019 06:00

Computers and Technology, 26.09.2019 06:00

Physics, 26.09.2019 06:00
Mathematics, 26.09.2019 06:00


