
Mathematics, 20.01.2021 04:10 shainaanderson24
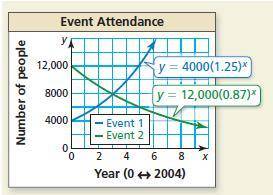
The graph shows the annual attendance at two events. Each event began in 2004.
a. Estimate when the events will have about the same attendance.
The events will have about the same attendance in the year ___.
b. Explain how you can verify your answer in part (a).
a. Substitute the answer in part (a) into both equations for y and solve for x.
b. Set the equations equal to zero, solve for x, then find the average of the two x-values.
c. Graph the two equations on a graphing calculator and use the intersect feature to find the point of intersection.
d. See how many times you have to multiply 4000 by 1.25 to obtain a product of approximately 12,000.

Answers: 2


Another question on Mathematics
Mathematics, 20.06.2019 18:04
What is the sum or difference 4x10 – 9x10 (1 point) –5x10 –5x20 –36x10 –36x20 this is the cca test i need all the answers this is the first 2
Answers: 2
Mathematics, 21.06.2019 20:30
Solve each quadratic equation by factoring and using the zero product property. 14x - 49 = x^2
Answers: 2
Mathematics, 21.06.2019 21:30
The length of a field is 100 yards and its width is 75 yards. if 1 inch represents 25 yards, what would be the dimensions of the field drawn on a sheet of paper?
Answers: 1
Mathematics, 21.06.2019 21:50
What is the 17th term in the arithmetic sequence in which a6 is 101 and a9 is 83
Answers: 1
You know the right answer?
The graph shows the annual attendance at two events. Each event began in 2004.
a. Estimate when the...
Questions

History, 26.08.2019 09:00
Mathematics, 26.08.2019 09:00


Mathematics, 26.08.2019 09:00

Mathematics, 26.08.2019 09:00
Mathematics, 26.08.2019 09:00
Mathematics, 26.08.2019 09:00

Social Studies, 26.08.2019 09:00
Mathematics, 26.08.2019 09:00
History, 26.08.2019 09:00
History, 26.08.2019 09:00
Mathematics, 26.08.2019 09:00


