
Mathematics, 20.01.2021 21:10 ariannayazmin052509
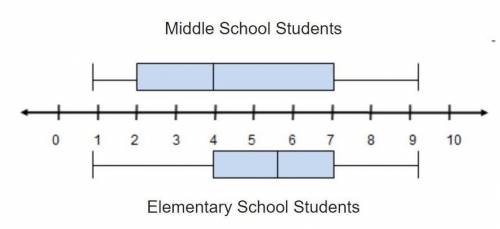
THIS TEST IS TIMED! The box plots show the number of hours of television a group of middle school students and a group of elementary school students watch each week.
Middle School Students
2 box plots. The number line goes from 0 to 10. For middle school students, the whiskers range from 1 to 9, and the box ranges from 2 to 7. A line divides the box at 4. For elementary school students, the whiskers range from 1 to 9, and the box ranges from 4 to 7. A line divides the box at 5.5.
Elementary School Students
Which correctly compares the medians and the measures of variability of the data in the box plots? Select three choices.
The difference in the medians is about 1.5 hours.
The range for both middle school students and elementary school students is 6 hours.
The interquartile range for middle school students is 5, and the interquartile range for elementary school students is 3.
Both sets of data have the same maximum and minimum values.
The medians for the two sets of data are the same.

Answers: 2


Another question on Mathematics
Mathematics, 21.06.2019 17:30
Can someone me and do the problem plz so i can understand it more better
Answers: 2
Mathematics, 21.06.2019 19:00
1. writing an equation for an exponential function by 2. a piece of paper that is 0.6 millimeter thick is folded. write an equation for the thickness t of the paper in millimeters as a function of the number n of folds. the equation is t(n)= 3. enter an equation for the function that includes the points. (-2, 2/5) and (-1,2)
Answers: 1
Mathematics, 21.06.2019 21:30
Carl's candies has determined that a candy bar measuring 3 inches long has a z-score of +1 and a candy bar measuring 3.75 inches long has a z-score of +2. what is the standard deviation of the length of candy bars produced at carl's candies?
Answers: 1
Mathematics, 21.06.2019 23:10
What is the radius of the cone in the diagram? round your answer to the nearest whole number
Answers: 2
You know the right answer?
THIS TEST IS TIMED! The box plots show the number of hours of television a group of middle school st...
Questions
Mathematics, 12.07.2019 17:10

Mathematics, 12.07.2019 17:10
Mathematics, 12.07.2019 17:10

English, 12.07.2019 17:10

Computers and Technology, 12.07.2019 17:10


Mathematics, 12.07.2019 17:10


