
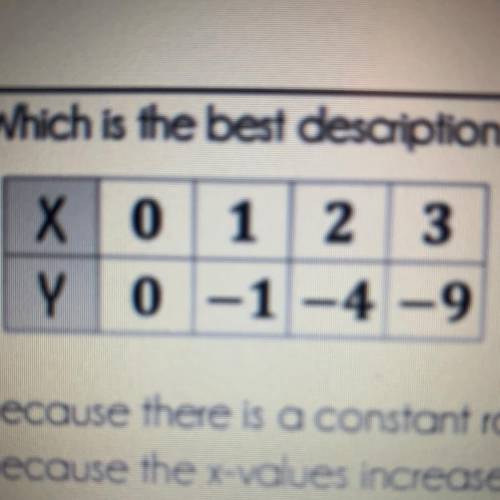
5.) Which is the best description of the table
below?
A. Linear because there is a cons...

Mathematics, 21.01.2021 01:10 achsahjosey
5.) Which is the best description of the table
below?
A. Linear because there is a constant rate of change
B. Linear because the X values increase by 1 each time
C. Nonlinear because there is not a constant rate of change
D. Nonlinear because the X values are positive while the Y values are negative

Answers: 3


Another question on Mathematics
Mathematics, 21.06.2019 14:30
Which interval for the graphed function contains the local maximum? [–3, –2] [–2, 0] [0, 2] [2, 4]
Answers: 2
Mathematics, 21.06.2019 18:40
The vertex of this parabola is at (-2,-3). when the x-value is -1, the y-value is -5. what is the coefficient of the squared expression in the parabola's equation?
Answers: 2
Mathematics, 21.06.2019 22:10
If p(a) = 0.70 and p(b) = 0.20, then a and b are independent events if
Answers: 3
Mathematics, 21.06.2019 23:00
Find the distance between the pair of points a(-1,8) and b(-8,4)
Answers: 1
You know the right answer?
Questions

History, 24.08.2020 01:01
Mathematics, 24.08.2020 01:01
Mathematics, 24.08.2020 01:01


Mathematics, 24.08.2020 01:01
English, 24.08.2020 01:01

Chemistry, 24.08.2020 01:01

Social Studies, 24.08.2020 01:01
Mathematics, 24.08.2020 01:01
Mathematics, 24.08.2020 01:01
Mathematics, 24.08.2020 01:01
Mathematics, 24.08.2020 01:01


