
Mathematics, 21.01.2021 16:50 Alexhall112
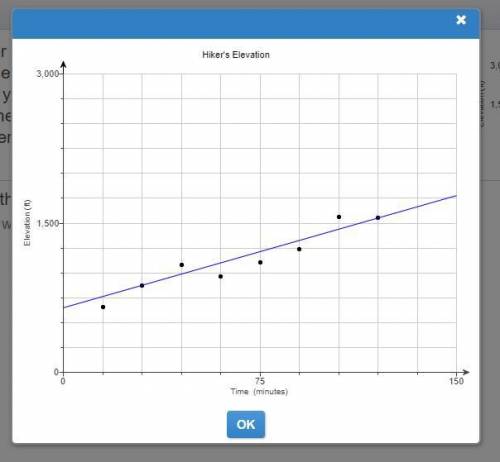
The scatter plot shows a hiker's elevation above sea level during a hike from the base to the top of a mountain. The equation of a trend line for the hiker's elevation is y=7.52x+649, where x represents the number of minutes and y represents the hiker's elevation in feet. Use the equation of the trend line to estimate the hiker's elevation after 170 minutes. After 170 minutes, the hiker's elevation will be about _ feet above sea level.

Answers: 3


Another question on Mathematics
Mathematics, 21.06.2019 15:30
What is the missing reason in step 5? linear pair postulategivendefinition of complementary anglescongruent complements theorem
Answers: 1
Mathematics, 21.06.2019 20:00
Solve each equation using the quadratic formula. find the exact solutions. 6n^2 + 4n - 11
Answers: 2
Mathematics, 21.06.2019 20:30
A. plot the data for the functions f(x) and g(x) on a grid and connect the points. x -2 -1 0 1 2 f(x) 1/9 1/3 1 3 9 x -2 -1 0 1 2 g(x) -4 -2 0 2 4 b. which function could be described as exponential and which as linear? explain. c. if the functions continue with the same pattern, will the function values ever be equal? if so, give estimates for the value of x that will make the function values equals. if not, explain why the function values will never be equal.
Answers: 3
You know the right answer?
The scatter plot shows a hiker's elevation above sea level during a hike from the base to the top of...
Questions

Business, 10.11.2020 02:30

English, 10.11.2020 02:30

Law, 10.11.2020 02:30


History, 10.11.2020 02:30
English, 10.11.2020 02:30
Mathematics, 10.11.2020 02:30
History, 10.11.2020 02:30
Mathematics, 10.11.2020 02:30
Mathematics, 10.11.2020 02:30
Mathematics, 10.11.2020 02:30
History, 10.11.2020 02:30
Mathematics, 10.11.2020 02:30

Biology, 10.11.2020 02:30


