Mathematics, 21.01.2021 17:10 alyssams4148
NEED HELP ASAP PLEASE
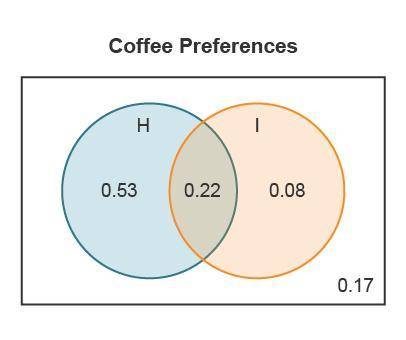
In a survey given by camp counselors, campers were asked if they like to swim and if they like to have a cookout. The Venn diagram displays the campers’ preferences.
A Venn Diagram titled Camp Preferences. One circle is labeled S, 0.06, the other circle is labeled C, 0.04, the shared area is labeled 0.89, and the outside area is labeled 0.01.
A camper is selected at random. Let S be the event that the camper likes to swim and let C be the event that the camper likes to have a cookout. What is the probability that a randomly selected camper does not like to have a cookout?
0.01
0.04
0.06
0.07


Answers: 2


Another question on Mathematics

Mathematics, 21.06.2019 16:30
Beth makes batches of bluberry muffins and banna muffins. each batchis 6 muffins. she makes 2.5 batches of bluberry muffins. how many batches of bananna muffins should beth make if she wants to have a total of 60 muffins?
Answers: 1

Mathematics, 21.06.2019 20:30
Which equation expression the relationship between the number of boxes b and the number of cans c and the proportion is 48
Answers: 1

Mathematics, 21.06.2019 23:30
Which two fractions are equivalent to 24/84? 6/42 and 2/7 6/21 and 2/6 12/42 and 3/7 12/42 and 2/7
Answers: 1

Mathematics, 21.06.2019 23:30
Graph the line with the given slope m and y-intercept b. m=-3,b=1
Answers: 1
You know the right answer?
NEED HELP ASAP PLEASE
In a survey given by camp counselors, campers were asked if they like to swim...
Questions


Arts, 31.08.2021 01:00

Mathematics, 31.08.2021 01:00


Mathematics, 31.08.2021 01:00

Mathematics, 31.08.2021 01:00


Mathematics, 31.08.2021 01:00


History, 31.08.2021 01:00


Social Studies, 31.08.2021 01:00


Mathematics, 31.08.2021 01:00


