
Mathematics, 21.01.2021 22:00 zuleromanos
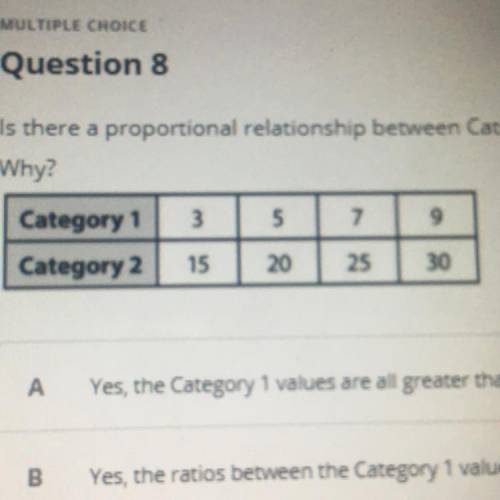
Is there a proportional relationship between Category 1 and Category 2 in the table below?
Why?
A
Yes, the Category 1 values are all greater than the Category 2 values.
B
Yes, the ratios between the Category 1 values and their corresponding Category 2 values
are equivalent
С
No, the Category 1 values equal the Category 2 values.
D
No, the ratios between the Category 1 values and their corresponding Category 2 values
are not equivalent
LOOK AT THE PIC FOR THE TABLE !!!
ANY HELP WILL BE GREATLY APPRECIATED

Answers: 2


Another question on Mathematics
Mathematics, 21.06.2019 16:20
Refer to interactive solution 17.45 to review a method by which this problem can be solved. the fundamental frequencies of two air columns are the same. column a is open at both ends, while column b is open at only one end. the length of column a is 0.504 m. what is the length of column b?
Answers: 1
Mathematics, 22.06.2019 00:30
Roy has 4 1/2 pizzas for the soccer team to split after the game. if each member is going to get 1/2 of a pizza, how many players are on the soccer team
Answers: 1
Mathematics, 22.06.2019 01:00
Arestaurant offers delivery for their pizzas. the total cost the customer pays is the price of the pizzas, plus a delivery fee. one customer pays $23 to have 2 pizzas delivered. another customer pays $59 for 6 pizzas. how many pizzas are delivered to a customer who pays $86?
Answers: 1
Mathematics, 22.06.2019 03:00
Atest of sobriety involves measuring the subject's motor skills. a sample of 31 randomly selected sober subjects take the test and produce a mean score of 64.4 with a standard deviation of 2. a claim is made that the true mean score for all sober subjects is equal to 65. for each part below, enter only a numeric value in the answer box. for example, do not type "z =" or "t =" before your answers. round each of your answers to 3 places after the decimal point. (a) calculate the value of the test statistic used in this test. test statistic's value = (b) use your calculator to find the p-value of this test. p-value = (c) use your calculator to find the critical value(s) used to test this claim at the 0.2 significance level. if there are two critical values, then list them both with a comma between them. critical value(s) =
Answers: 2
You know the right answer?
Is there a proportional relationship between Category 1 and Category 2 in the table below?
Why?
Questions

History, 03.11.2019 00:31

Mathematics, 03.11.2019 00:31
Mathematics, 03.11.2019 00:31

Social Studies, 03.11.2019 00:31


Biology, 03.11.2019 00:31

Mathematics, 03.11.2019 00:31
Mathematics, 03.11.2019 00:31
English, 03.11.2019 00:31
Mathematics, 03.11.2019 00:31
English, 03.11.2019 00:31
Biology, 03.11.2019 00:31
Mathematics, 03.11.2019 00:31


