
Mathematics, 21.01.2021 22:30 ousmaner
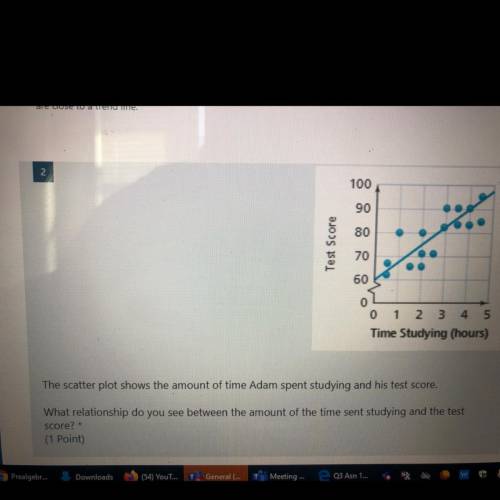
The scatter plot shows the amount of time Adam spent studying and his test score.
What relationship do you see between the amount of the time sent studying and the test
score?
(1 Point)
In general, Adam scores higher on a test when he spends more time studying. There is not a linear relationship.
In general, Adam scores higher on a test when he spends more time studying. There is a positive linear
relationship.
In general, Adam scores lower on a test when he spends more time studying. There is a negative linear
relationship
In general, Adam scores lower on a test when he spends more time studying. There is not a relationship.

Answers: 3


Another question on Mathematics
Mathematics, 21.06.2019 17:00
The sum of the reciprocal of a positive number and the reciprocal of 2 more than the number is 3/4 equation: the number is
Answers: 2
Mathematics, 21.06.2019 21:00
What number line represents the solution set for the inequality -1/2 greater than or equal to 4
Answers: 1
Mathematics, 21.06.2019 21:10
For each sentence below, find the value of x that makes each sentence true. (515) 5 = 25* x= (813)2 = 4* x=
Answers: 2
Mathematics, 21.06.2019 22:30
Which of the following would be a reasonable estimate for the weight of a pencil? a. 1 × 10^-20 lb b. 1 × 10^20 lb c. 1 × 10^2 lb d. 1 × 10^-2 lb
Answers: 1
You know the right answer?
The scatter plot shows the amount of time Adam spent studying and his test score.
What relationship...
Questions


Mathematics, 24.06.2019 04:20
Mathematics, 24.06.2019 04:20
Mathematics, 24.06.2019 04:30
Mathematics, 24.06.2019 04:30
Mathematics, 24.06.2019 04:30


