Mathematics, 21.01.2021 23:10 Britney8394
For 75 employees of a large department store, the following distribution for years of service was obtained. Construct a histogram, frequency polygon, and ogive for the data. (The data for this exercise will be used for Exercise 14 in this section.)
Class limits Frequency
1-5 21
6-10 25
11-15 15
16-20 0
21-25 8
26-30 6
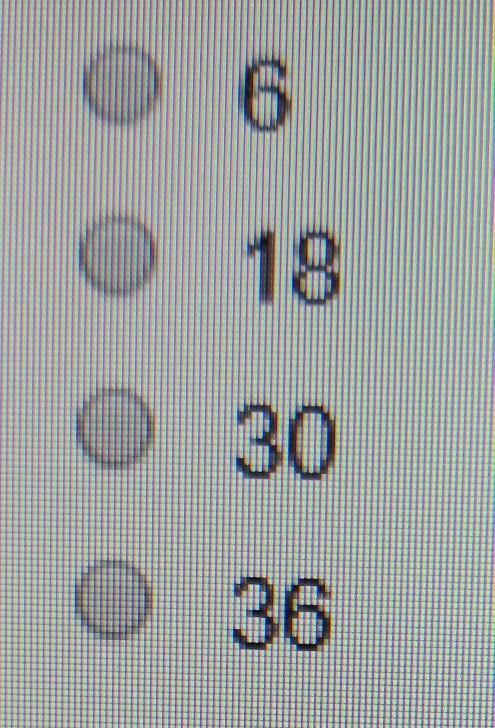
A majority of the employees have worked for how many years or less?

Answers: 2


Another question on Mathematics

Mathematics, 21.06.2019 12:30
Can someone explain the elimination method to me for this problem?
Answers: 1

Mathematics, 21.06.2019 19:30
Joel wants to buy a new tablet computer fram a store having a 20% off sale on all tablets. the tablet he wants has an original cost of $190. he also wants to make sure he has enough money to pay the 5% sales tax. part one joel uses the incorect expression 0.95(190)(0.8) to calculate that the tablet will cost him a total of $144.40. describe his error and write the correct expression part two how much will joel pay for the tablet show your work if you answer this question correctly you will receive a prize of 99 points good luck
Answers: 2

Mathematics, 21.06.2019 19:50
Asequence is defined recursively using the formula f(n + 1) =f(n) - 5. which sequence could be
Answers: 1

Mathematics, 21.06.2019 20:00
A. what does the point (4, 122) represent? b. what is the unit rate? c. what is the cost of buying 10 tickets?
Answers: 2
You know the right answer?
For 75 employees of a large department store, the following distribution for years of service was ob...
Questions

Mathematics, 14.02.2022 22:30

Physics, 14.02.2022 22:30


Chemistry, 14.02.2022 22:30

Chemistry, 14.02.2022 22:30


Mathematics, 14.02.2022 22:40

History, 14.02.2022 22:40


Chemistry, 14.02.2022 22:40


