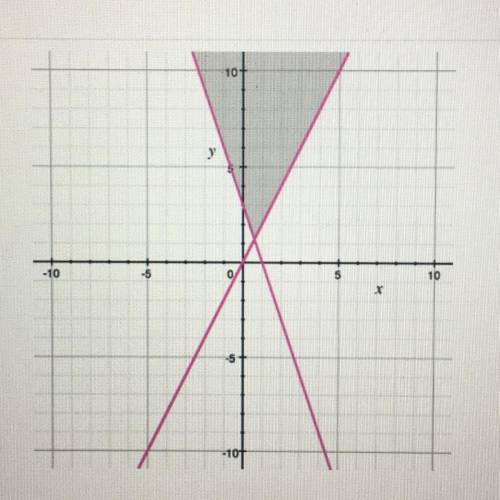
The graph shows the solution to which system of inequalities?
A) y>-3x+3 and y>2x
B) y≤...

Mathematics, 22.01.2021 17:30 jaclynnlyidaowdxnq
The graph shows the solution to which system of inequalities?
A) y>-3x+3 and y>2x
B) y≤-3x+3 and y≤2x
C) y≤-3x+3 and y≥2x
D) y≥-3x+3 and y≥2x

Answers: 1


Another question on Mathematics
Mathematics, 21.06.2019 15:30
Given the box plot, will the mean or the median provide a better description of the center? box plot with min at 10.5, q1 at 11.5, median at 12.5, q3 at 13.5, max at 15
Answers: 2
Mathematics, 21.06.2019 18:30
Create a data set with 8 points in it that has a mean of approximately 10 and a standard deviation of approximately 1.
Answers: 1
Mathematics, 21.06.2019 20:30
Kayaks rent for $35 per day. which expression can you use to find the cost in dollars of renting 3 kayaks for a day?
Answers: 1
Mathematics, 21.06.2019 21:40
Question 1 of 10 2 points different groups of 50 graduates of an engineering school were asked the starting annual salary for their first engineering job after graduation, and the sampling variability was low. if the average salary of one of the groups was $65,000, which of these is least likely to be the average salary of another of the groups? o a. $64,000 o b. $65,000 o c. $67,000 o d. $54,000
Answers: 2
You know the right answer?
Questions

SAT, 01.04.2021 19:30
Mathematics, 01.04.2021 19:30


Mathematics, 01.04.2021 19:30
English, 01.04.2021 19:30
Mathematics, 01.04.2021 19:30

Computers and Technology, 01.04.2021 19:30
English, 01.04.2021 19:30

Mathematics, 01.04.2021 19:30


