
Mathematics, 22.01.2021 19:10 HistoryLee
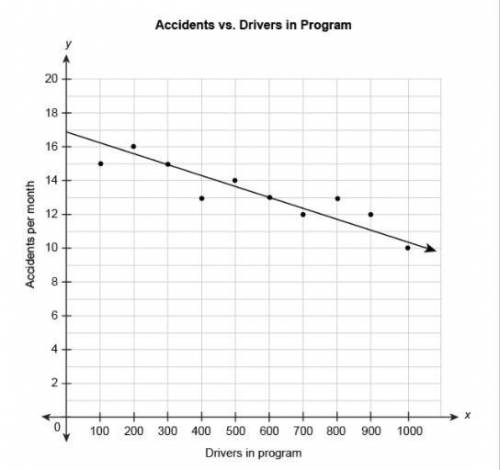
The scatter plot shows the relationship between the number of car accidents in a month and the number of drivers attending a program on distracted driving. The equation represents the linear model for this data.
y=−0.0067x+17
What does the number -0.0067 in the equation mean in this context?
The number of accidents increased by 0.67 per month for every additional 100 drivers in the program.
1.)The number of accidents was reduced by 0.67 per month for every additional driver in the program.
2.)The number of accidents was reduced by 0.67 per month for every additional 100 drivers in the program.
3.)The number of accidents was reduced by 0.67 per month every month.
4.)There were 0.67 accidents per month.

Answers: 3


Another question on Mathematics
Mathematics, 21.06.2019 20:10
Which value of m will create a system of parallel lines with no solution? y = mx - 6 8x - 4y = 12
Answers: 3
Mathematics, 21.06.2019 23:10
Which graph represents the linear function below? y-4= (4/3)(x-2)
Answers: 2
Mathematics, 21.06.2019 23:30
Atruck can be rented from company a $50 a day plus $0.60 per mile. company b charges $20 a day plus $0.80 per mile to rent the same truck. find the number of miles in a day at which the rental costs for company a and company b are the same
Answers: 1
You know the right answer?
The scatter plot shows the relationship between the number of car accidents in a month and the numbe...
Questions
Mathematics, 06.06.2020 10:58

Mathematics, 06.06.2020 10:58
Mathematics, 06.06.2020 10:58


Chemistry, 06.06.2020 10:58
Mathematics, 06.06.2020 10:58
Mathematics, 06.06.2020 10:58


English, 06.06.2020 10:58
Mathematics, 06.06.2020 10:58

Computers and Technology, 06.06.2020 10:58
Mathematics, 06.06.2020 10:58
Mathematics, 06.06.2020 10:58

Social Studies, 06.06.2020 10:58


