
Mathematics, 22.01.2021 19:20 bri9263
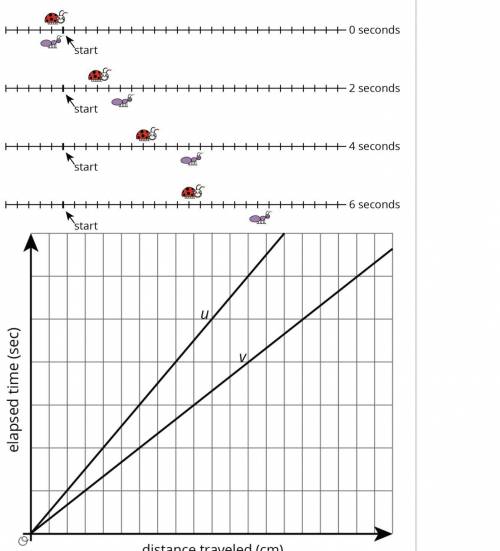
A ladybug and ant move at constant speeds. The diagrams with tick marks show their positions at different times. Each tick mark represents 1 centimeter.
In your textbook pg. 111, scale the vertical and horizontal axes by labeling each grid line with a number. You will need to use the time and distance information in the tick-mark diagrams.
Which line shows the ladybugs movement? The ant?
Unit rate for the Ladybug? The ant?
How long does it take for the ladybug to travel 12 cm? The ant?

Answers: 2


Another question on Mathematics
Mathematics, 21.06.2019 13:30
Nell has a sales clerk job that pays $12 per hour for regular gas work hours. she gets double time for any hours over 40 that she works in a week. how many hours did nell work if her weekly pay was $744
Answers: 1
Mathematics, 21.06.2019 13:40
Vip at (-2,7) dropped her pass and moved to the right on a slope of -9 where can you catch up to her to return her vip pass
Answers: 1
Mathematics, 21.06.2019 14:30
Ou have a 20-ounce bottle of juice. you pour out 14 of the bottle to share with a friend. if you pour out 3 ounces for yourself, what fraction of the 20 ounces will be left in the bottle? clear check 35 25 12 1320
Answers: 2
Mathematics, 21.06.2019 15:10
Which system of linear inequalities is graphed? can somebody pleasssse
Answers: 3
You know the right answer?
A ladybug and ant move at constant speeds. The diagrams with tick marks show their positions at diff...
Questions
Mathematics, 09.11.2019 10:31


History, 09.11.2019 10:31

Biology, 09.11.2019 10:31
Mathematics, 09.11.2019 10:31

English, 09.11.2019 10:31
English, 09.11.2019 10:31
History, 09.11.2019 10:31

Mathematics, 09.11.2019 10:31
Biology, 09.11.2019 10:31

Mathematics, 09.11.2019 10:31
Mathematics, 09.11.2019 10:31


