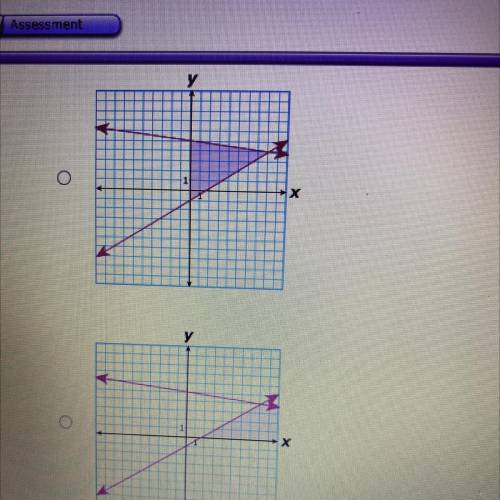
Which graph best represents the feasibility region for the system above?
{x>_0
Y<_ -1/8...

Mathematics, 24.01.2021 20:10 neariah24
Which graph best represents the feasibility region for the system above?
{x>_0
Y<_ -1/8x+5
Y>_5/8x-1

Answers: 2


Another question on Mathematics
Mathematics, 21.06.2019 19:30
Which of the points a(6, 2), b(0, 0), c(3, 2), d(−12, 8), e(−12, −8) belong to the graph of direct variation y= 2/3 x?
Answers: 2
Mathematics, 21.06.2019 21:00
Evaluate this using ! 0.25^2 x 2.4 + 0.25 x 2.4^2 − 0.25 x 2.4 x 0.65
Answers: 1
Mathematics, 21.06.2019 22:00
Problem situation: caren is making rice and beans. she can spend no more than $10 on ingredients. she buys one bag of rice for $4.99. beans cost $0.74 per pound. how many pounds of beans, x, can she buy? inequality that represents this situation: 10≥4.99+0.74x drag each number to show if it is a solution to both the inequality and the problem situation, to the inequality only, or if it is not a solution.
Answers: 1
Mathematics, 21.06.2019 22:30
Which of the following circles have their centers in the third quadrant? check all that apply.
Answers: 1
You know the right answer?
Questions


Physics, 11.10.2019 18:10


Mathematics, 11.10.2019 18:10


