
Mathematics, 25.01.2021 05:20 asdfjk6421
Understand Statistics - Tutorial - Level
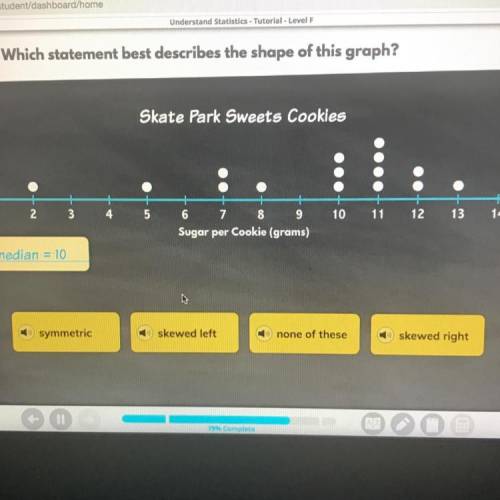
Which statement best describes the shape of this graph?
Skate Park Sweets Cookies
600+
1
2
3
4
5
10
11
13
12
14
6 7 8 9
Sugar per Cookie (grams)
median = 10
symmetric
skewed left
none of these
skewed right

Answers: 1


Another question on Mathematics
Mathematics, 21.06.2019 19:30
Can someone me with the property questions for 12 13 and 14 plz
Answers: 2
Mathematics, 21.06.2019 19:50
Drag each tile into the correct box. not all tiles will be used. find the tables with unit rates greater than the unit rate in the graph. then tenge these tables in order from least to greatest unit rate
Answers: 2
Mathematics, 21.06.2019 20:40
Lines a and b are parallel. what is the value of x? -5 -10 -35 -55
Answers: 2
You know the right answer?
Understand Statistics - Tutorial - Level
Which statement best describes the shape of this graph?
Questions


Physics, 24.08.2019 23:00

History, 24.08.2019 23:00
History, 24.08.2019 23:00

Chemistry, 24.08.2019 23:00
History, 24.08.2019 23:00
English, 24.08.2019 23:00

Social Studies, 24.08.2019 23:00

English, 24.08.2019 23:00
Mathematics, 24.08.2019 23:00
English, 24.08.2019 23:00

Biology, 24.08.2019 23:00
History, 24.08.2019 23:00
English, 24.08.2019 23:00
History, 24.08.2019 23:00


