
Mathematics, 25.01.2021 15:20 goforthmusic235
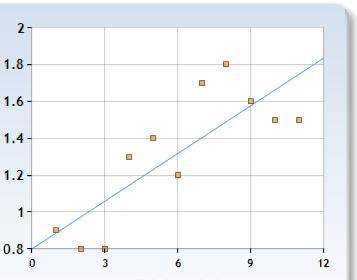
The data below represents the relationship between the number of incidences of UFO sightings in late 1930s and early 1940s. Draw a scatter plot for the data. Year of Incidence 1936 1937 1938 1939 1940 1941 1942 1943 1944 1945 1946 Number of Incidences (percent) 0.9 0.8 0.8 1.3 1.4 1.2 1.7 1.8 1.6 1.5 1.5

Answers: 1


Another question on Mathematics
Mathematics, 21.06.2019 15:00
Prove that 3: 8 is equivalent to 12: 32.a. use diagrams to support your answer.
Answers: 1
Mathematics, 21.06.2019 15:00
Given the choice between receiving $1.000.000 in one month or a single penny-doubled everyday for the period of one month; which option would you choice? show your work to support your answer. (assume that 1 month=30 days)
Answers: 1
Mathematics, 21.06.2019 16:30
What is the equation of a vertical line passing through the point (−5, −1)? y = −5 y = −1 x = −5 x = −1
Answers: 2
Mathematics, 21.06.2019 20:30
In the diagram of circle o, what is the measure of zabc?
Answers: 2
You know the right answer?
The data below represents the relationship between the number of incidences of UFO sightings in late...
Questions

Computers and Technology, 28.07.2021 02:00


Biology, 28.07.2021 02:00


Chemistry, 28.07.2021 02:00
Mathematics, 28.07.2021 02:00

History, 28.07.2021 02:00


