
Mathematics, 25.01.2021 20:00 anthonylemus36
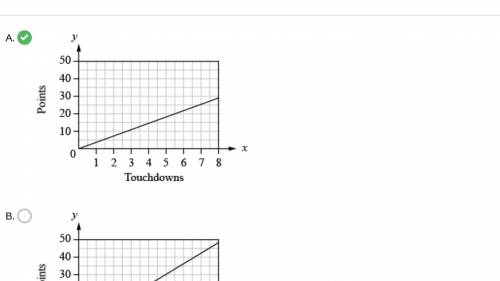
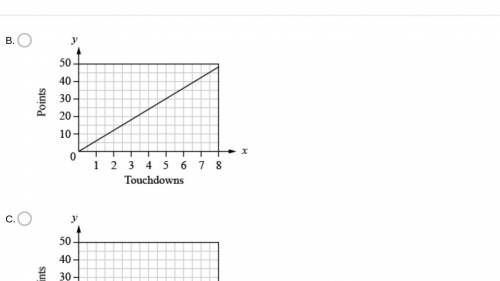
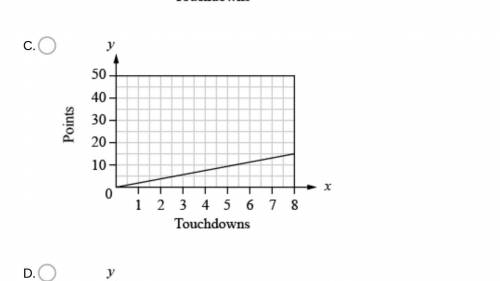
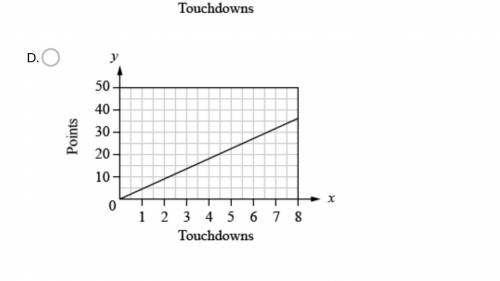
Which graph represents the proportional relationship of 6 points for each touchdown?

Answers: 3


Another question on Mathematics
Mathematics, 21.06.2019 14:30
Our goal is to collect email addresses from 60% of customers who purchase a product." so that means if i talk to 95 customers, i need to persuade to provide an email address?
Answers: 1
Mathematics, 21.06.2019 17:00
Determine the number of outcomes in the event. decide whether the event is a simple event or not. upper a computer is used to select randomly a number between 1 and 9 comma inclusive. event upper b is selecting a number greater than 4. event upper b has nothing outcome(s). is the event a simple event? (yes or no) because event upper b has (fewer than, exactly, more than) one outcome.
Answers: 1
Mathematics, 21.06.2019 22:30
Kevin's bank offered him a 4.5% interest rate for his mortgage. if he purchases 3 points, what will be his new rate?
Answers: 2
Mathematics, 22.06.2019 01:30
Ineed with question three. i don't understand how i'm supposed to achieve 3 marks.
Answers: 2
You know the right answer?
Which graph represents the proportional relationship of 6 points for each touchdown?
Questions


Chemistry, 11.01.2021 19:30
Mathematics, 11.01.2021 19:30

Mathematics, 11.01.2021 19:30
English, 11.01.2021 19:30
Mathematics, 11.01.2021 19:30
Mathematics, 11.01.2021 19:30
Mathematics, 11.01.2021 19:30
Mathematics, 11.01.2021 19:30
English, 11.01.2021 19:30
English, 11.01.2021 19:30

Arts, 11.01.2021 19:30
Mathematics, 11.01.2021 19:30


