15%
step-by-step explanation:
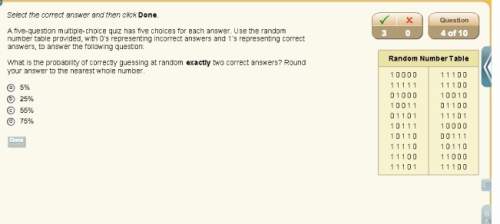
use the table and count the number of guesses that has two correct answers.
the following are two correct answers
10010, 01100, 11000
a total of 3 numbers having 2 correct guesses out of 20 questions.
probability of getting 2 correct guesses = the number of questions getting 2 correct answers / total number of questions.
= 3/20
to convert it into percent multiply by 100, we get
= 3/20 * 100
= 15%
the answer is 15%
you.