
Mathematics, 25.01.2021 22:10 lalacada1
(05.01)
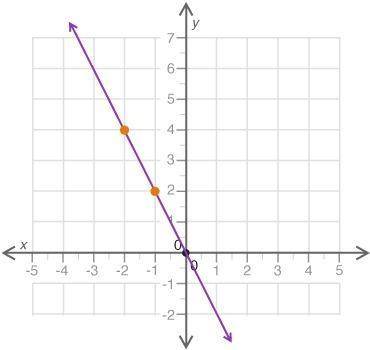
Which statement best explains if the graph correctly represents the proportional relationship y = −2x?
No, the points shown would not be part of y = −2x
No, proportions cannot be represented on a graph
Yes, all proportions can be shown on a graph of this line
Yes, the points shown on the line would be part of y = −2x

Answers: 1


Another question on Mathematics
Mathematics, 21.06.2019 16:40
The table shows the total distance that myra runs over different time periods. which describes myra’s distance as time increases? increasing decreasing zero constant
Answers: 2
Mathematics, 21.06.2019 19:00
Aplot of land has been surveyed for a new housing development with borders ab, bc, dc, and da. the plot of land is a right trapezoid with a height of 60 feet and an opposite leg length of 65 feet
Answers: 1
Mathematics, 21.06.2019 19:50
98 point question what is the record for most points in one
Answers: 2
Mathematics, 21.06.2019 23:00
The coordinate grid shows a pentagon. the pentagon is translated 3 units to the right and 5 units up to create a new pentagon. what is the rule for the location of the new pentagon?
Answers: 3
You know the right answer?
(05.01)
Which statement best explains if the graph correctly represents the proportional relationsh...
Questions


History, 06.11.2021 09:40

Social Studies, 06.11.2021 09:40
Mathematics, 06.11.2021 09:40


Biology, 06.11.2021 09:40
History, 06.11.2021 09:40

Computers and Technology, 06.11.2021 09:40

Social Studies, 06.11.2021 09:40
Arts, 06.11.2021 09:40
Mathematics, 06.11.2021 09:40
SAT, 06.11.2021 09:40
Mathematics, 06.11.2021 09:40
Mathematics, 06.11.2021 09:40


