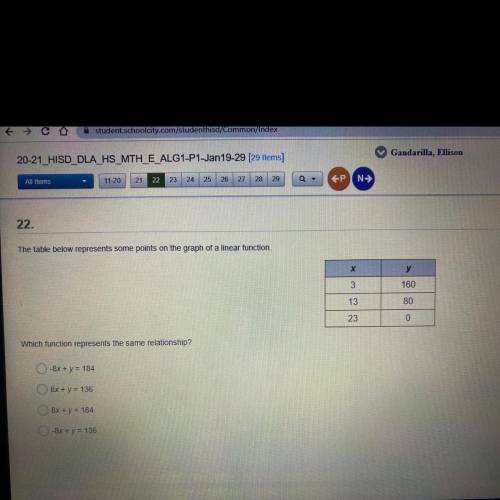
22.
The table below represents some points on the graph of a linear function
y
3
...

Mathematics, 25.01.2021 22:20 Nason156
22.
The table below represents some points on the graph of a linear function
y
3
160
13
80
23
0
Which function represents the same relationship?
0-8x + y = 184
8x + y = 136
8x + y = 184
-8x + y = 136
O Type here to search
Copyright 202
BI

Answers: 1


Another question on Mathematics
Mathematics, 21.06.2019 21:00
A25- foot ladder leans against a building and reaches a point of 23.5 feet above the ground .find the angle that the ladder makes with the building
Answers: 2
Mathematics, 22.06.2019 01:00
Which of the following statements is true? a. the irrational number system is not closed under multiplication, because the product of two irrational numbers is always a rational number. b. the irrational number system is not closed under multiplication, because the product of two irrational numbers is not always an irrational number. c. the irrational number system is closed under multiplication, because the product of two irrational numbers is always an irrational number. d. the irrational number system is closed under multiplication, because the product of two irrational numbers is always a rational numbers. reset submit
Answers: 1
Mathematics, 22.06.2019 01:30
Asample of 200 rom computer chips was selected on each of 30 consecutive days, and the number of nonconforming chips on each day was as follows: the data has been given so that it can be copied into r as a vector. non.conforming = c(10, 15, 21, 19, 34, 16, 5, 24, 8, 21, 32, 14, 14, 19, 18, 20, 12, 23, 10, 19, 20, 18, 13, 26, 33, 14, 12, 21, 12, 27) #construct a p chart by using the following code. you will need to enter your values for pbar, lcl and ucl. pbar = lcl = ucl = plot(non.conforming/200, ylim = c(0,.5)) abline(h = pbar, lty = 2) abline(h = lcl, lty = 3) abline(h = ucl, lty = 3)
Answers: 3
You know the right answer?
Questions

History, 03.12.2019 16:31
Mathematics, 03.12.2019 16:31
Mathematics, 03.12.2019 16:31

Geography, 03.12.2019 16:31

English, 03.12.2019 16:31
Mathematics, 03.12.2019 16:31
English, 03.12.2019 16:31
Mathematics, 03.12.2019 16:31

Biology, 03.12.2019 16:31

Health, 03.12.2019 16:31
Geography, 03.12.2019 16:31

Physics, 03.12.2019 16:31
Mathematics, 03.12.2019 16:31
English, 03.12.2019 16:31


