
Mathematics, 25.01.2021 23:00 ehklu1226
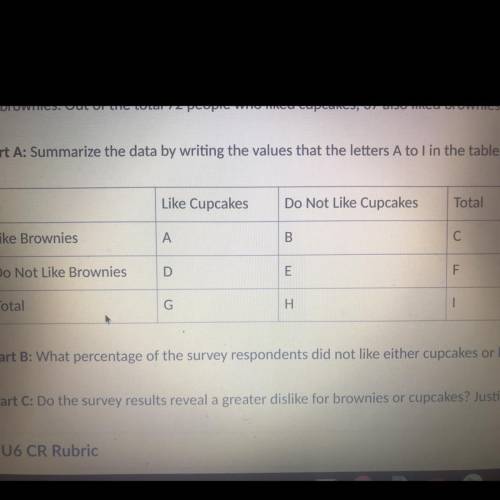
A bakery did a survey among 100 customers to find their food preference . The customers were asked about their preferences for cupcakes or brownies. Out of the total 72 people who liked cupcakes, 37 also liked brownies. There were 59 people who liked brownies.
Part A. Summarize the data by writing the values that the letters A to I in the table below represents
PART B. What percentage of the survey respondents did not like cupcakes or brownies ?
PART C . Do the survey results reveal a greater dislike for brownies or cupcakes? Justify your answer.
PLZZZ HELP

Answers: 1


Another question on Mathematics
Mathematics, 21.06.2019 16:00
Question part points submissions used suppose that 100 lottery tickets are given out in sequence to the first 100 guests to arrive at a party. of these 100 tickets, only 12 are winning tickets. the generalized pigeonhole principle guarantees that there must be a streak of at least l losing tickets in a row. find l.
Answers: 2
Mathematics, 21.06.2019 21:00
Out of $20$ creepy-crawly creatures in a room, $80\%$ are flies and $20\%$ are spiders. if $s\%$ of the total legs belong to spiders, what is $s$?
Answers: 2
Mathematics, 21.06.2019 22:30
Convert (-3,0) to polar form. a. (3,0’) b. (-3,180’) c. (3,180’) d. (3,360’)
Answers: 1
You know the right answer?
A bakery did a survey among 100 customers to find their food preference . The customers were asked a...
Questions
Mathematics, 10.06.2021 22:30


History, 10.06.2021 22:30
Mathematics, 10.06.2021 22:30
Mathematics, 10.06.2021 22:30
Mathematics, 10.06.2021 22:30


Biology, 10.06.2021 22:30


