
Mathematics, 26.01.2021 01:00 s103394
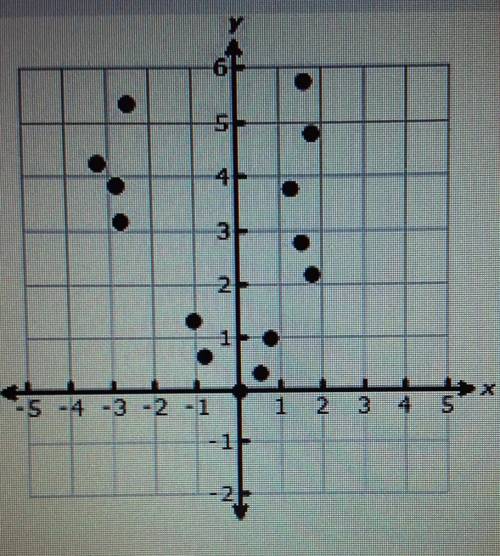
A scatterplot is shown below. What type of relationship is shown in the graph?
A. proportional
B. Linear
C. non-linear
D. constant

Answers: 1


Another question on Mathematics
Mathematics, 20.06.2019 18:04
If the graph of f(x)=9x^2+37x+41/3x+5 has an oblique asymptote at y=3x+k what is the value of k
Answers: 1
Mathematics, 21.06.2019 18:00
If f(x) = 4x – 3 and g(x) = 8x + 2, find each function value a.f[g(3)] b.g[f(5)] c.g{f[g(-4)]}
Answers: 3
You know the right answer?
A scatterplot is shown below. What type of relationship is shown in the graph?
A. proportional
Questions

English, 08.10.2021 21:20

Biology, 08.10.2021 21:20
Mathematics, 08.10.2021 21:20

Social Studies, 08.10.2021 21:20

Chemistry, 08.10.2021 21:20
Mathematics, 08.10.2021 21:20
English, 08.10.2021 21:20
Chemistry, 08.10.2021 21:20
Mathematics, 08.10.2021 21:20
Chemistry, 08.10.2021 21:20

History, 08.10.2021 21:20
Social Studies, 08.10.2021 21:20

Physics, 08.10.2021 21:20

Geography, 08.10.2021 21:20
Mathematics, 08.10.2021 21:20
Mathematics, 08.10.2021 21:20


