
Mathematics, 26.01.2021 17:50 Amazingboliver4518
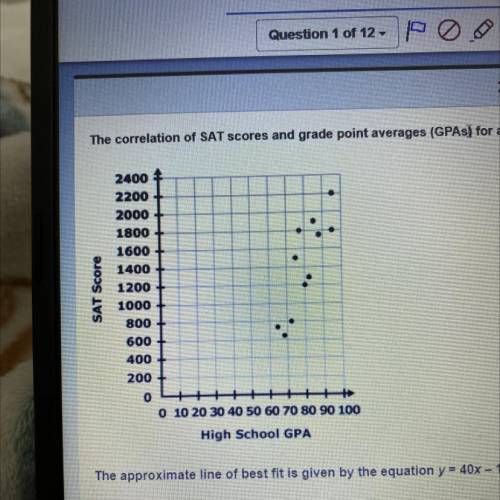
The correlation of SAT scores and grade point averages (GPAs) for a random sample of high school students is represented by the scatterplot below.
The approximate line of best fit is given by the equation y - 40x - 1800. Based on this trend, which of the following best predicts the SAT score for a high school student with a GPA of 95?
1895
2000
2200
1980
(click on the photo for the graph)

Answers: 2


Another question on Mathematics
Mathematics, 21.06.2019 19:20
Based on the diagram, match the trigonometric ratios with the corresponding ratios of the sides of the triangle. tiles : cosb sinb tanb sincposs matches: c/b b/a b/c c/a
Answers: 2
Mathematics, 22.06.2019 02:00
Thirteen bowlers were asked what their score was on their last game. the scores are shown below 190,150,154,194,181,190,170,151,170,178,161,180 find the range of the bowlers score a.56 b.44 c.34 d.23
Answers: 1
Mathematics, 22.06.2019 02:30
(fog)(x) if f(x)=x^2- 4 and g(x)=x^2 + 2 x, f(g(x))= f(x^2+2x) (x^2+2x)^2-4 (x^2+2x)(x^2+2x)-4 (x^4+2x^3+5x+4x^2)-4 x^4+2x^3+4x^2+5x-4 what am i doing wrong
Answers: 1
You know the right answer?
The correlation of SAT scores and grade point averages (GPAs) for a random sample of high school stu...
Questions


History, 10.01.2020 19:31


Physics, 10.01.2020 19:31

History, 10.01.2020 19:31
Mathematics, 10.01.2020 19:31
English, 10.01.2020 19:31

History, 10.01.2020 19:31
History, 10.01.2020 19:31
Mathematics, 10.01.2020 19:31
History, 10.01.2020 19:31
Mathematics, 10.01.2020 19:31


