Help please!
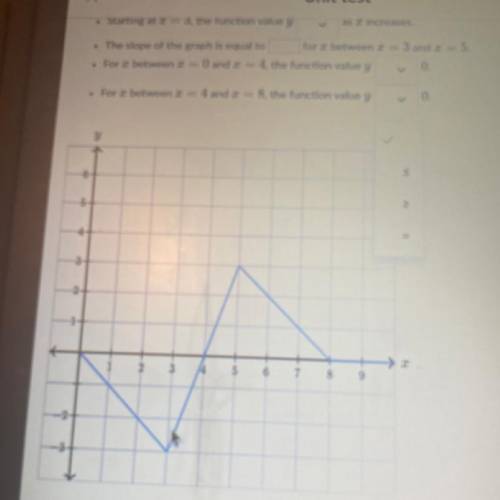
The illustration below shows the graph of y as a function of 2.
Complete the fol...

Mathematics, 27.01.2021 08:00 andydiaz1227
Help please!
The illustration below shows the graph of y as a function of 2.
Complete the following sentences based on the graph of the function.
Initially, as I increases, y
for all I between I = 0 and I = 3.
• The slope of the graph is equal to
Starting at I = 3, the function value y
.
V
as I increases.
• The slope of the graph is equal to for I between I = 3 and 2 = 5.
• For I between 2 = 0 and 3 = 4, the function value y 0.
• For between I = 4 and I = 8, the function value y
0.
y


Answers: 2


Another question on Mathematics

Mathematics, 21.06.2019 21:10
Lines b and c are parallel. what is the measure of 2? m2 = 31° m2 = 50° m2 = 120° m2 = 130°
Answers: 2

Mathematics, 21.06.2019 22:00
18 16 11 45 33 11 33 14 18 11 what is the mode for this data set
Answers: 2

Mathematics, 22.06.2019 01:10
Which has the greater energy, light of wavelength 519 nm or light with a frequency of 5.42 x 10^8 sec^-1?
Answers: 2

Mathematics, 22.06.2019 02:00
What are linear equations? could'ya explain too me, ? ! and how do you see what graph is a proportional relationship?
Answers: 2
You know the right answer?
Questions

Mathematics, 23.03.2020 22:46

Mathematics, 23.03.2020 22:46


Chemistry, 23.03.2020 22:46


Mathematics, 23.03.2020 22:46

French, 23.03.2020 22:46

Biology, 23.03.2020 22:46

Mathematics, 23.03.2020 22:46

Mathematics, 23.03.2020 22:46

History, 23.03.2020 22:46


English, 23.03.2020 22:46

History, 23.03.2020 22:46

Computers and Technology, 23.03.2020 22:46


