Mathematics, 28.01.2021 20:30 neemy
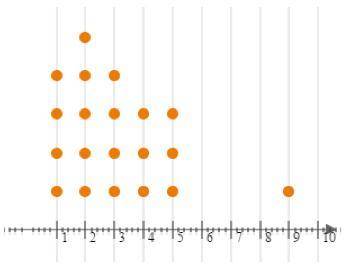
PLEASE I REALLY NEED HELP NOW!! The data for numbers of times per week 20 students at Stackamole High eat vegetables are shown below:
Part A: Describe the dotplot. (4 points)
Part B: What, if any, are the outliers in these data? Show your work. (3 points)
Part C: What is the best measure of center for these data? Explain your reasoning. (3 points) (10 points)


Answers: 3


Another question on Mathematics

Mathematics, 21.06.2019 17:30
Which are factor pairs of 350? choose all answers that are correct. a) 30 and 12 b) 35 and 10 c) 70 and 5 d) 2 and 125
Answers: 2

Mathematics, 21.06.2019 18:00
How many triangles can be drawn with side lengths 4 centimeters, 4.5 centimeters, and 9 centimeters? explain
Answers: 1

Mathematics, 21.06.2019 23:00
Given the expression (7 ? 4i) ? (2 + 6i), perform the indicated operation and write the answer in the form a + bi.
Answers: 1

Mathematics, 21.06.2019 23:40
The frequency table shows the results of a survey asking people how many hours they spend online per week. on a piece of paper, draw a histogram to represent the data. then determine which answer choice matches the histogram you drew. in order here is the.. hours online: 0-3, 4-7, 8-11, 12-15, and 16-19. frequency: 5, 8, 10, 8, 7 answer for the question is in the picture! : )
Answers: 2
You know the right answer?
PLEASE I REALLY NEED HELP NOW!! The data for numbers of times per week 20 students at Stackamole Hig...
Questions


Mathematics, 05.02.2020 06:56


History, 05.02.2020 06:56


Mathematics, 05.02.2020 06:56


Mathematics, 05.02.2020 06:56

Social Studies, 05.02.2020 06:56


History, 05.02.2020 06:56


Mathematics, 05.02.2020 06:56

Mathematics, 05.02.2020 06:56


