
Mathematics, 29.01.2021 05:00 jenn8055
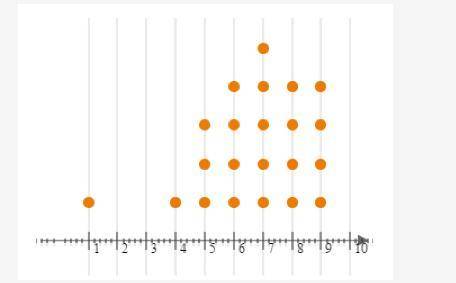
The data for numbers of times per week 22 students at Diggamole High eat fruit are shown below:
Part A: Describe the dotplot.
Part B: What, if any, are the outliers in these data? Show your work.
Part C: What is the best measure of center for these data? Explain your reasoning.

Answers: 3


Another question on Mathematics
Mathematics, 21.06.2019 15:30
Guests at an amusement park must be at least 54 inches tall to be able to ride the roller coaster. which graph represents the set of heights that satisfy this requirement?
Answers: 3
Mathematics, 21.06.2019 21:30
Aladder that is 20ft long is leaning against the side of a building. if the angle formed between the ladder and the ground is 75 degrees how far is the bottom of the from the base of the building?
Answers: 1
You know the right answer?
The data for numbers of times per week 22 students at Diggamole High eat fruit are shown below:
Par...
Questions


Biology, 22.08.2019 14:20
Mathematics, 22.08.2019 14:30

Chemistry, 22.08.2019 14:30

Mathematics, 22.08.2019 14:30
English, 22.08.2019 14:30
English, 22.08.2019 14:30
Mathematics, 22.08.2019 14:30
Mathematics, 22.08.2019 14:30
History, 22.08.2019 14:30
Mathematics, 22.08.2019 14:30


