Step-by-step explanation:
Equation of a line:
The equation of a line has the following format:

In which m is the slope, and b is the y-intercept(value of y when x = 0).
In this question:
We have that when  . So the line is given by:

Finding the slope:
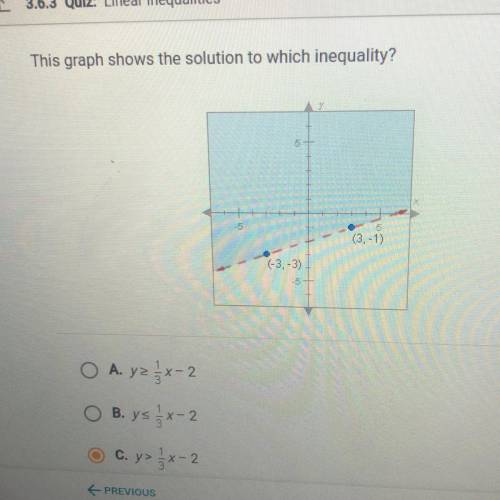
We have two points in the line, which are (-3,-3) and (3,-1). The slope is given by the change in y divided by the change in x. So
Change in y: -1 - (-3) = -1 + 3 = 2
Change in x: 3 - (-3) = 3 + 3 = 6
Slope: 
Solution to the inequality:
The solution to this inequality is all the points above the dashed line, which means that the dashed line is not part of the solution. So