
Mathematics, 31.01.2021 23:10 JDKozlova
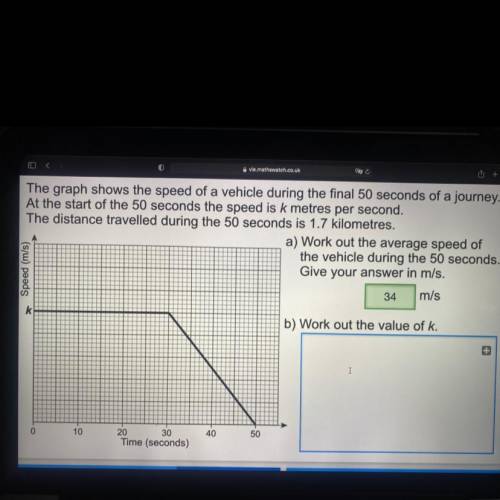
The graph shows the speed of a vehicle during the final 50 seconds of a journey.
At the start of the 50 seconds the speed is k metres per second.
The distance travelled during the 50 seconds is 1.7 kilometres.
a) Work out the average speed of
the vehicle during the 50 seconds.
Give your answer in m/s.
34 m/s
* Speed (m/s)
b) Work out the value of k.
10
40
50
20 30
Time (seconds)

Answers: 3


Another question on Mathematics
Mathematics, 21.06.2019 14:30
Factor. 8x2y2 – 4x2y – 12xy 4(8x2y2 – x – 12xy) 4(2xy – 4x2y – 12xy) 4x2y2(2xy – xy –3) 4xy(2xy – x – 3)
Answers: 2
Mathematics, 21.06.2019 15:00
Pick the description of a geometric object that best matches the real world object box for a deck of card
Answers: 1
Mathematics, 21.06.2019 16:00
In the 30-60-90 triangle below side s has a length of and side r has a length
Answers: 2
Mathematics, 21.06.2019 18:30
Let f(x) = 3 − x . find the average rate of change of f(x) from x = a to x = a + h and simplify your answer so that no single factor of h is left in the denominator.
Answers: 1
You know the right answer?
The graph shows the speed of a vehicle during the final 50 seconds of a journey.
At the start of th...
Questions


History, 22.06.2019 19:00
English, 22.06.2019 19:00

Mathematics, 22.06.2019 19:00
Mathematics, 22.06.2019 19:00
Biology, 22.06.2019 19:00

Mathematics, 22.06.2019 19:00
English, 22.06.2019 19:00


