
Mathematics, 01.02.2021 18:20 lovely222
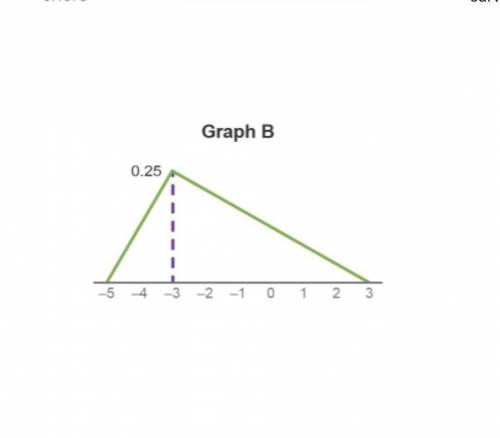
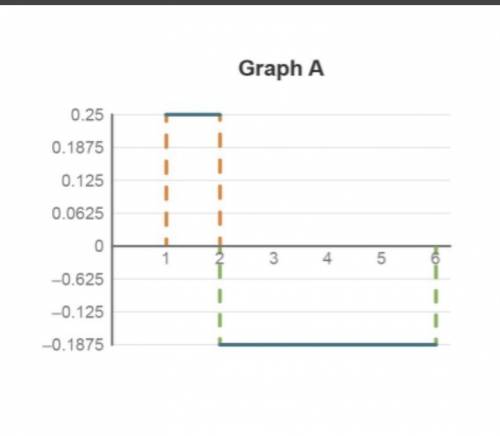
2 graphs. Graph A: a dotted line goes from (1, 0) to (1, 0.25), is solid and horizontal to (2, 0.25), is dotted to (2, negative 0.1875), is solid and horizontal to (6, negative 0.1875), and then is dotted to (6, 0). Graph B. A line goes from (negative 5, 0) to (negative 3, 0.25), and then decreases to (3, 0).
Which statement about the graphs is true?
Graph A is a valid density curve because the part of the graph from 2 to 6 is below the horizontal axis.
Graph A is not a valid density curve because the part of the graph from 1 to 2 is above the horizontal axis.
Graph B is not a valid density curve because part of the horizontal axis has negative values.
Graph B is a valid density curve because the curve is above the horizontal axis, and the area under the curve is 1.

Answers: 1


Another question on Mathematics
Mathematics, 21.06.2019 14:10
What is the perimeter, p, of a rectangle that has a length of x + 8 and a width of y − 1? p = 2x + 2y + 18 p = 2x + 2y + 14 p = x + y − 9 p = x + y + 7
Answers: 3
Mathematics, 21.06.2019 16:30
Amuffin recipe, which yields 12 muffins, calls for cup of milk for every 1 cups of flour. the same recipe calls for cup of coconut for every cup of chopped apple. to yield a batch of 30 muffins, how much flour will be needed in the mix?
Answers: 1
Mathematics, 21.06.2019 21:00
Mr. thompson is on a diet. he currently weighs 260 pounds. he loses 4 pounds per month. what part of the story makes the relationship not proportional?
Answers: 3
You know the right answer?
2 graphs. Graph A: a dotted line goes from (1, 0) to (1, 0.25), is solid and horizontal to (2, 0.25)...
Questions


Social Studies, 10.03.2020 19:04

English, 10.03.2020 19:04
Mathematics, 10.03.2020 19:04
Mathematics, 10.03.2020 19:04


