
Mathematics, 02.02.2021 01:00 Person51761
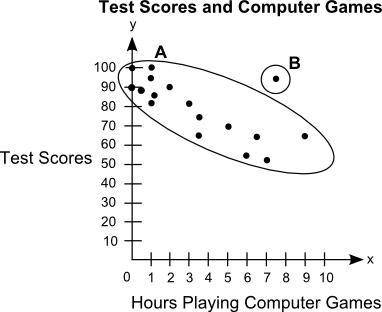
The scatter plot shows the relationship between the test scores of a group of students and the number of hours they play computer games in a week: On a grid, Label Hours Playing Computer Games on x axis and Test Scores on y axis. The title of the graph is Test Scores and Computer Games. The scale on the x axis shows the numbers from 0 to 10 at increments of 1, and the scale on the y axis shows numbers from 0 to 100 at increments of 10. Dots are made at the ordered pairs 0, 90 and 0, 100 and 0.5, 89 and 1, 81 and 1, 95 and 1, 100 and 1.1, 85 and 2, 90 and 3, 81 and 3.5, 65 and 3.5, 75 and 5, 70 and 6, 55 and 6.5, 65 and 7, 52 and 7.5, 95 and 9, 65. The ordered pair 7.5, 95 is circled and labeled as B. All the other points are put in an oval and labeled as A. Part A: What is the group of points labeled A called? What is the point labeled B called? Give a possible reason for the presence of point B. (5 points) Part B: Describe the association between students' test scores and the number of hours they play computer games. (5 points)

Answers: 2


Another question on Mathematics
Mathematics, 21.06.2019 20:00
Last one and the bottom answer choice is y=(x-4)^2+1 you guys!
Answers: 1
Mathematics, 21.06.2019 22:40
Ntriangle abc, m∠a = 35° and m∠b = 40°, and a=9. which equation should you solve to find b?
Answers: 2
Mathematics, 22.06.2019 01:00
You went to a restaurant and spent $53.25 on the meal. there was a 6% sales tax. what was the amount of money, not including a tip, you spent at the restaurant?
Answers: 1
Mathematics, 22.06.2019 02:00
Look at this system of equations. -3x + 3y = 12 y = x + 4 the solution set of this system is best explained by which of these statements? a) the graphs of the equations are the same line because the equations have the same slope and the same y-intercept. the system has infinitely many solutions. b) the graphs of the equations are parallel lines because they have the same slope but different y-intercepts. the system has no solution. c) the graphs of the equations are lines that intersect at one point because the equations have the same slope but different y-intercepts. the system has exactly one solution. d) the graphs of the equations are lines that intersect at one point because the equations have the same slope and the same y-intercept. the system has exactly one solution.
Answers: 2
You know the right answer?
The scatter plot shows the relationship between the test scores of a group of students and the numbe...
Questions
Mathematics, 13.04.2021 15:00

Physics, 13.04.2021 15:00

History, 13.04.2021 15:00
Mathematics, 13.04.2021 15:00
Mathematics, 13.04.2021 15:00

World Languages, 13.04.2021 15:00
Mathematics, 13.04.2021 15:00

Chemistry, 13.04.2021 15:00
History, 13.04.2021 15:00
Mathematics, 13.04.2021 15:00
Chemistry, 13.04.2021 15:00

Social Studies, 13.04.2021 15:00

Geography, 13.04.2021 15:00

Mathematics, 13.04.2021 15:00
Mathematics, 13.04.2021 15:00
Mathematics, 13.04.2021 15:00


