
Mathematics, 03.02.2021 03:10 Andrebutrus
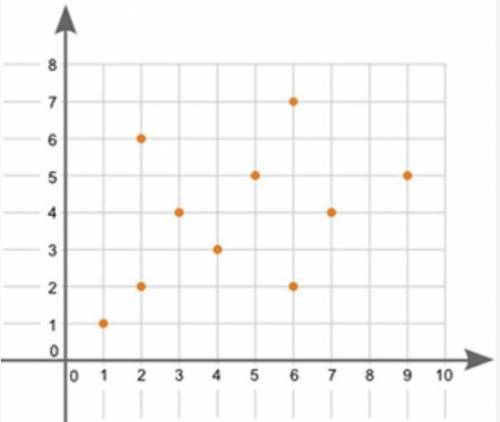
(06.01)What type of association does the graph show between x and y?
A scatter plot is shown. Data points are located at 1 and 1, 3 and 4, 2 and 2, 4 and 3, 2 and 6, 6 and 7, 7 and 4, 5 and 5, 6 and 2, 9 and 5.
Linear positive association
Nonlinear positive association
Nonlinear negative association
No association

Answers: 3


Another question on Mathematics
Mathematics, 21.06.2019 13:00
The chart below shows the distribution of weeds in yard
Answers: 2
Mathematics, 21.06.2019 15:40
Need ! discuss how to convert the standard form of the equation of a circle to the general form. 50 points
Answers: 1
Mathematics, 21.06.2019 17:00
Line gh passes through points (2, 5) and (6, 9). which equation represents line gh? y = x + 3 y = x – 3 y = 3x + 3 y = 3x – 3
Answers: 1
You know the right answer?
(06.01)What type of association does the graph show between x and y?
A scatter plot is shown. Data...
Questions

English, 10.12.2021 18:10

History, 10.12.2021 18:10

English, 10.12.2021 18:10


Arts, 10.12.2021 18:10

Mathematics, 10.12.2021 18:10
Mathematics, 10.12.2021 18:10

Social Studies, 10.12.2021 18:10
Arts, 10.12.2021 18:10
Mathematics, 10.12.2021 18:10

Biology, 10.12.2021 18:10


