
Mathematics, 03.02.2021 06:00 Animallover100
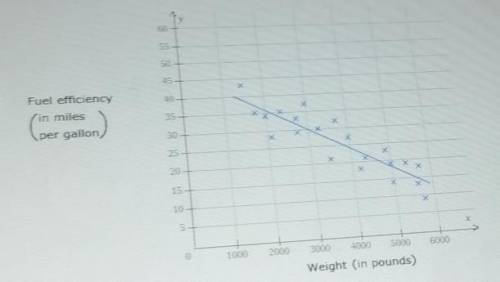
HELP ME PLEASE I WILL GIVE BRIANIEST the scatter plot shows the weight efficiency for each of 21 vehicles also show us the line of best fit for a data. fill in the blank below.
for this 21 vehicles that's weight increases fuel efficiency tends to ...
for these 21 vehicles there is ... correlation between weight and fuel efficiency
using the amount of best fit we would predict that a vehicle weighing 3,000 lb will have a fuel efficiency of approximately ... miles per gallon.

Answers: 1


Another question on Mathematics
Mathematics, 21.06.2019 18:30
An arc subtends a central angle measuring 7pi/4 radians what fraction of the circumference is this arc?
Answers: 1
Mathematics, 21.06.2019 19:00
The focus of parabola is (-4, -5), and its directrix is y= -1. fill in the missing terms and signs in parabolas equation in standard form
Answers: 1
Mathematics, 21.06.2019 21:00
Select the correct answer from each drop-down menu. a system of equations and its solution are given below. system a complete the sentences to explain what steps were followed to obtain the system of equations below. system b to get system b, the equation in system a was replaced by the sum of that equation and times the equation. the solution to system b the same as the solution to system a.]
Answers: 1
You know the right answer?
HELP ME PLEASE I WILL GIVE BRIANIEST the scatter plot shows the weight efficiency for each of 21 veh...
Questions

Biology, 15.04.2020 21:58

Geography, 15.04.2020 21:58

Medicine, 15.04.2020 21:58
Mathematics, 15.04.2020 21:58

Spanish, 15.04.2020 21:58


Mathematics, 15.04.2020 21:59

Mathematics, 15.04.2020 21:59


