Mathematics, 03.02.2021 06:40 Jacobstoltzfus
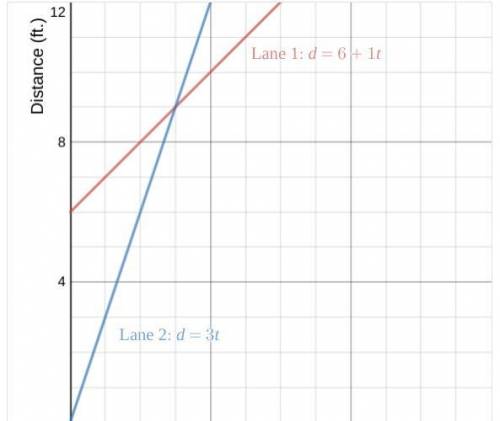
This graph shows the distance vs. time relationship for the Lane 1 and Lane 2 turtles. Here are their equations:
Lane 1: d= 6+ 1t
Lane 2: d = 3t
Select all of the true statements.
(Select all that apply.)
1. The Lane 2 turtle is faster than the Lane 1 turtle.
2. At 3 seconds, the turtle in Lane 2 is 12 feet from the start.
3. At 12 seconds, the turtle in Lane 1 is 6 feet from the start.
4. The Lane 1 turtle has a head start.


Answers: 3


Another question on Mathematics


Mathematics, 21.06.2019 18:00
You paid 28.00 for 8 gallons of gasoline. how much would you pay for 15 gallons of gasoline?
Answers: 1

Mathematics, 21.06.2019 19:20
Which number line represents the solution set for the inequality - x 24?
Answers: 3

Mathematics, 21.06.2019 21:00
Type the correct answer in each box. use numerals instead of words. if necessary, use / fir the fraction bar(s). the graph represents the piecewise function: h
Answers: 3
You know the right answer?
This graph shows the distance vs. time relationship for the Lane 1 and Lane 2 turtles. Here are thei...
Questions

Biology, 10.04.2020 22:57


History, 10.04.2020 22:57


Mathematics, 10.04.2020 22:57

Mathematics, 10.04.2020 22:57


English, 10.04.2020 22:57


Biology, 10.04.2020 22:57


History, 10.04.2020 22:57


Mathematics, 10.04.2020 22:58

History, 10.04.2020 22:58

 . For
. For  , then
  . Hence, the turtle in Lane 2 is just 9 feet from the start. ( FALSE)
 . For
. For  , then
  . Hence, the turtle is 12 feet from the start. ( FALSE)


