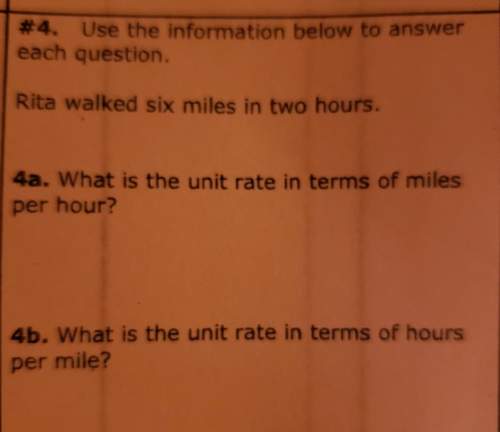
-4 < -50
which situation could the inequality represent
A divers from sea floor at 4...

Mathematics, 03.02.2021 20:50 jaydahh4059
-4 < -50
which situation could the inequality represent
A divers from sea floor at 4 feet per minute and is now less than 50 feet from the surface. for how many minutes could he have been rising?
Helen has been watching a movie for 50 minutes and 4 minutes are left. if she arrived at the movie late how many minutes could the movie be?
it is 4 degrees in buffalo and it is 50 degrees below zero in alaska. how many times colder is it in Alaska?
imran has been borrowing $4 each week and as a result he is now more than $50 in dept. for how many weeks could he have been borrowing?

Answers: 1


Another question on Mathematics

Mathematics, 21.06.2019 22:20
1. 2. ∠b and ∠y are right angles. 3.? 4.? which two statements are missing in steps 3 and 4? ∠x ≅ ∠c △abc ~ △zyx by the sas similarity theorem. ∠b ≅ ∠y △abc ~ △zyx by the sas similarity theorem. = 2 △abc ~ △zyx by the sss similarity theorem. = 2 △abc ~ △zyx by the sss similarity theorem.
Answers: 2

Mathematics, 22.06.2019 03:00
Describe how the presence of possible outliers might be identified on the following. (a) histograms gap between the first bar and the rest of bars or between the last bar and the rest of bars large group of bars to the left or right of a gap higher center bar than surrounding bars gap around the center of the histogram higher far left or right bar than surrounding bars (b) dotplots large gap around the center of the data large gap between data on the far left side or the far right side and the rest of the data large groups of data to the left or right of a gap large group of data in the center of the dotplot large group of data on the left or right of the dotplot (c) stem-and-leaf displays several empty stems in the center of the stem-and-leaf display large group of data in stems on one of the far sides of the stem-and-leaf display large group of data near a gap several empty stems after stem including the lowest values or before stem including the highest values large group of data in the center stems (d) box-and-whisker plots data within the fences placed at q1 â’ 1.5(iqr) and at q3 + 1.5(iqr) data beyond the fences placed at q1 â’ 2(iqr) and at q3 + 2(iqr) data within the fences placed at q1 â’ 2(iqr) and at q3 + 2(iqr) data beyond the fences placed at q1 â’ 1.5(iqr) and at q3 + 1.5(iqr) data beyond the fences placed at q1 â’ 1(iqr) and at q3 + 1(iqr)
Answers: 1

Mathematics, 22.06.2019 07:30
Consider the function cot x. which of the following are true? select all that apply.
Answers: 1

Mathematics, 22.06.2019 07:40
If the discriminant if a qudratic equation is 4, which statement describes the roots?
Answers: 1
You know the right answer?
Questions


Mathematics, 15.01.2021 21:00


Chemistry, 15.01.2021 21:00


Mathematics, 15.01.2021 21:00


Mathematics, 15.01.2021 21:00

Mathematics, 15.01.2021 21:00

Mathematics, 15.01.2021 21:00

Mathematics, 15.01.2021 21:00

Mathematics, 15.01.2021 21:00


Chemistry, 15.01.2021 21:00

Arts, 15.01.2021 21:00

Mathematics, 15.01.2021 21:00

Engineering, 15.01.2021 21:00


