
Mathematics, 04.02.2021 16:10 bookworm43
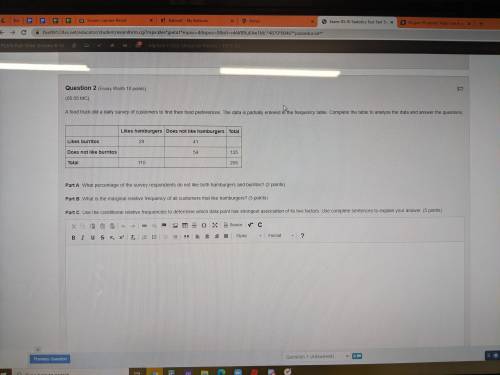
A food truck did a daily survey of customers to find their food preferences. The data is partially entered in the frequency table. Complete the table to analyze the data and answer the questions:
Likes hamburgers Does not like hamburgers Total
Likes burritos 29 41
Does not like burritos 54 135
Total 110 205
Part A: What percentage of the survey respondents do not like both hamburgers and burritos? (2 points)
Part B: What is the marginal relative frequency of all customers that like hamburgers? (3 points)
Part C: Use the conditional relative frequencies to determine which data point has strongest association of its two factors. Use complete sentences to explain your answer. (5 points)

Answers: 1


Another question on Mathematics
Mathematics, 21.06.2019 13:30
Geometry answer picture question pls . reason and statements
Answers: 3
Mathematics, 21.06.2019 17:00
How many of the 250 grandparents in the population would you expect to prefer online shopping with merchant a? merchant a: 4 merchant b: 6 merchant c: 2 merchant d: 3 other: 5 none: 5 answer choices: a.about 4 b.about 8 c.about 40 d.about 21
Answers: 1
You know the right answer?
A food truck did a daily survey of customers to find their food preferences. The data is partially e...
Questions
Mathematics, 01.07.2019 12:30
Mathematics, 01.07.2019 12:30
Mathematics, 01.07.2019 12:30


History, 01.07.2019 12:30
Mathematics, 01.07.2019 12:30


Biology, 01.07.2019 12:30
Mathematics, 01.07.2019 12:30


