
Mathematics, 04.02.2021 18:10 aprilreneeclaroxob0c
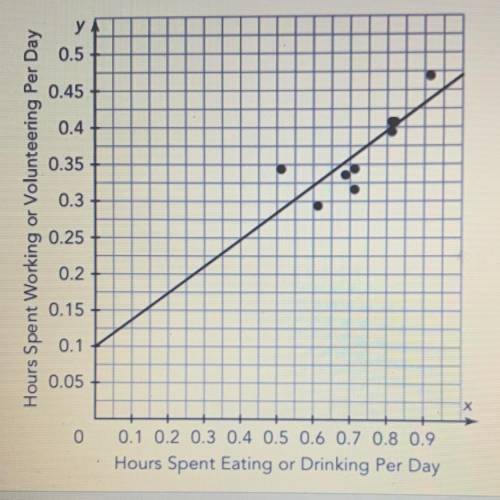
The graph shows the number of hours per day spent eating or drinking by a group of teenagers and the
number of hours per day spent working or volunteering. A line of best fit for the data is shown
A.) use the graph to determine the average number of hours a teenager would spend working or volunteering if they spent 0.6 hours eating or drinking.
B.) use the graph to determine the average number of hours a teenager would spend working or volunteering if they spent 1.2 hours eating or drinking.

Answers: 3


Another question on Mathematics
Mathematics, 21.06.2019 15:30
What is the length of the missing leg in this right triangle? 18 mm 24 mm 26 mm 32 mm
Answers: 1
Mathematics, 21.06.2019 18:10
Find the value of p for which the polynomial 3x^3 -x^2 + px +1 is exactly divisible by x-1, hence factorise the polynomial
Answers: 1
Mathematics, 21.06.2019 19:30
We just started the introduction into circles and i have no idea how to do this.
Answers: 3
Mathematics, 21.06.2019 21:30
Worth 15 points handsome jack is buying a pony made of diamonds. the price of the pony is p dollars, and jack also has to pay a 25% diamond pony tax. which of the following expressions could represent how much jack pays in total for the pony? a= p = 1/4 b= p+0.25p c=(p + 1/4)p d=5/4p 0.25p choose 2 answers
Answers: 1
You know the right answer?
The graph shows the number of hours per day spent eating or drinking by a group of teenagers and the...
Questions

English, 13.09.2020 01:01
Mathematics, 13.09.2020 01:01
Mathematics, 13.09.2020 01:01
Mathematics, 13.09.2020 01:01

Chemistry, 13.09.2020 01:01

Geography, 13.09.2020 01:01
Mathematics, 13.09.2020 01:01
Mathematics, 13.09.2020 01:01
Mathematics, 13.09.2020 01:01
Geography, 13.09.2020 01:01
Mathematics, 13.09.2020 01:01
Mathematics, 13.09.2020 01:01
Mathematics, 13.09.2020 01:01
Mathematics, 13.09.2020 01:01
Mathematics, 13.09.2020 01:01
Mathematics, 13.09.2020 01:01

Biology, 13.09.2020 01:01

History, 13.09.2020 02:01
Mathematics, 13.09.2020 02:01
Mathematics, 13.09.2020 02:01


