Which of the following best describes the data?
10
8
7
6
5
4
3<...

Mathematics, 05.02.2021 19:00 tiarabivens0
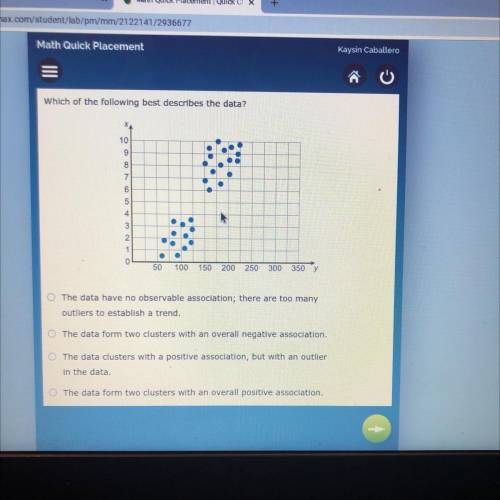
Which of the following best describes the data?
10
8
7
6
5
4
3
2
1
50 100 150 200 250 300 350
The data have no observable association; there are too many
outliers to establish a trend.
The data form two clusters with an overall negative association.
The data clusters with a positive association, but with an outller
in the data.
The data form two clusters with an overall positive association

Answers: 1


Another question on Mathematics
Mathematics, 21.06.2019 17:00
In the given figure ar(adf) =ar(cda) and ar(cdf) = ar(cdf). show that abdc and cdfe are trapeziums.
Answers: 2
Mathematics, 21.06.2019 21:00
Ftara spends $219 a month for her car payment and she makes $3,200 a month, what percent of her monthly income is spent on her car payment?
Answers: 2
Mathematics, 21.06.2019 23:40
Full year - williamshow many square inches are in 60 square feet? 5 square inches72 square inches720 square inche8.640 square inches
Answers: 1
You know the right answer?
Questions


Computers and Technology, 13.11.2019 18:31


Computers and Technology, 13.11.2019 18:31


