
Mathematics, 06.02.2021 22:40 anna8352
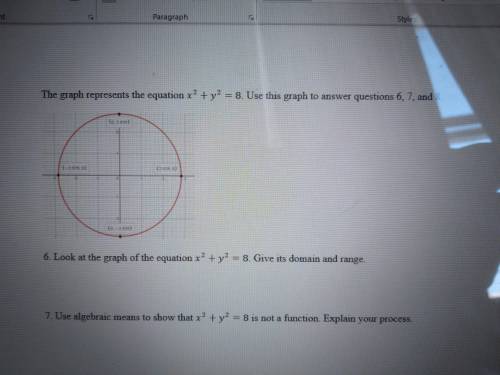
The graph represents the x^2+y^2=8. Use the graph to answer questions 6,7,8.
6. look at the graph of the equation x^2+y^2=8. give its domaim and range
7. use algebraic means to show that x^2+y^2=8 is not a function. Explain your process.
8. is there any value(s) of the domain of x^2+y^2=8 that passes the verticle line test? if so, name the value(s) and state whether or not the existence of this value makes this relation a function. You can use Desmos to help you explore this idea, if needed.

Answers: 2


Another question on Mathematics
Mathematics, 21.06.2019 18:30
Select 2 statements that are true about the equation y+6=-10(x-3).1) the slope of the line is -102) the slope of the line is 33) one point on the line is (3,6)4) one point on the line is (3,-6)
Answers: 1
Mathematics, 21.06.2019 21:50
What function has a range {yly< 5}? question on picture above^
Answers: 3
Mathematics, 21.06.2019 22:40
Adeli owner keeps track of the to-go orders each day. the results from last saturday are shown in the given two-way frequency table. saturday's to-go deli orders in person by phone online total pick up 38 25 31 94 delivery 35 28 34 97 total 73 53 65 191 what percent of the to-go orders were delivery orders placed by phone? a. 14.66% b. 38.41% c. 28.87% d. 52.83%
Answers: 2
Mathematics, 21.06.2019 23:00
The table below shows the function f. determine the value of f(3) that will lead to an average rate of change of 19 over the interval [3, 5]. a. 32 b. -32 c. 25 d. -25
Answers: 2
You know the right answer?
The graph represents the x^2+y^2=8. Use the graph to answer questions 6,7,8.
6. look at the graph o...
Questions
Mathematics, 08.09.2020 20:01

History, 08.09.2020 20:01


Social Studies, 08.09.2020 20:01
Social Studies, 08.09.2020 20:01
History, 08.09.2020 20:01

Mathematics, 08.09.2020 20:01


